


A new version of the Global Registry of Acute Coronary Events (GRACE) risk score (version 2.0) has been released recently. The purpose of the present study was to assess the validity of GRACE 2.0 for in-hospital and 1-year mortality in non-ST-elevation acute coronary syndrome (NSTE-ACS) patients.
MethodsThe prospective cohort comprised 396 consecutive NSTE-ACS patients admitted to a tertiary hospital between May 2012 and January 2013. The main outcome measure was the discrimination and calibration performance of GRACE 2.0, which were evaluated with the area under the receiver operating characteristic curve (AUC) and the Hosmer-Lemeshow goodness-of-fit test, respectively.
ResultsIn-hospital and 1-year mortality were 2% (8/396) and 12.4% (48/388), respectively. The discrimination performance was inadequate (AUC=0.62) for predicting in-hospital mortality for the overall cohort. Also, the calibration performance for in-hospital mortality could not be evaluated due to the low number of patients who died. At one year, the Hosmer-Lemeshow p-values for all subgroups were >0.05, suggesting a good model fit, and the discrimination performance was good (AUC=0.77) for the overall cohort, driven mainly by better accuracy for low-risk patients.
ConclusionsIn a contemporary cohort of NSTE-ACS patients, GRACE 2.0 was valid for 1-year mortality assessment. Its value for in-hospital mortality requires validation in a larger cohort.
Foi recentemente publicada uma nova versão do score de risco do Global Registry of Acute Coronary Events (GRACE). O objetivo do presente estudo consistiu em avaliar a validade da versão GRACE 2,0 em doentes com síndrome coronária aguda sem elevação do segmento ST (NSTE-ACS) internados e mortalidade a um ano.
MétodosA coorte prospetiva compreendeu 396 doentes consecutivos com NSTE-ACS admitidos num hospital terciário entre maio de 2012 e janeiro de 2013. A principal medida do resultado foi a discriminação e o desempenho da aferição da versão 2,0 do estudo GRACE, avaliadas com a área sob a curva característica do recetor (AUC) e com o teste de adesão Hosmer-Lemeshow, respetivamente.
ResultadosO internamento e a mortalidade a um ano foram de 2% (8 em 396) e de 12,4% (48 em 388), respetivamente. O desempenho da discriminação foi inadequado (AUC = 0,62) para a previsão da mortalidade intra-hospitalar para a coorte global. Também a avaliação do desempenho da aferição para a mortalidade intra-hospitalar foi inapropriada devido ao reduzido número de mortes. A um ano, os valores–p Hosmer-Lemeshow para todos os grupos foram > 0,05 sugerindo um modelo adequado; e o desempenho da discriminação foi bom (AUC = 0,77) para a coorte global, orientada principalmente por uma melhor precisão para os doentes de baixo risco.
ConclusõesNum coorte contemporânea de doentes NSTE-ACS, o estudo GRACE 2,0 foi considerado válido para avaliação da mortalidade a um ano. O seu valor para a mortalidade intra-hospitalar requer validação numa coorte superior.
Individualized risk stratification for optimal management of acute coronary syndrome (ACS) helps to identify high-risk patients who could benefit most from invasive strategies and prevents complications from unnecessary treatment in low-risk patients, in addition to helping with counseling on prognosis. Accordingly, clinical practice guidelines recommend that risk assessment should be initiated soon after admission, and that the Global Registry of Acute Coronary Events (GRACE) risk score should be preferred to all other risk scores because of its superior accuracy.1–3 The GRACE risk score (version 1.0) was developed from a large multinational prospective patient registry and validated in several studies for the prediction of in-hospital and 6-month mortality rates across a wide range of ACS.4–23 However, it was introduced in the 2000s and its predictive accuracy may not be adequate for current clinical practice, as use of evidence-based therapies has now increased.1–3 An update (version 2.0) was therefore released recently.24 The new risk score (GRACE 2.0) was presented as a more accurate tool than GRACE 1.0, with prediction of mortality over the longer term (1 and 3 years).24 It was derived from the GRACE registry with over 32000 patients enrolled between 2002 and 2007, from 14 countries in Europe, North and South America and Australia. However, this substantial geographic variation has led to the need for validation in different countries. Accordingly, the purpose of the present study was to validate GRACE 2.0 in Turkey.
MethodsPatient populationThis was a prospective observational validation study of GRACE 2.0 for in-hospital and 1-year mortality in a contemporary cohort of patients with non-ST-elevation acute coronary syndrome (NSTE-ACS) (i.e. unstable angina [UA] and non-ST-elevation myocardial infarction [NSTEMI]) admitted to a tertiary hospital between May 2012 and January 2013. Patients with symptoms and signs compatible with ACS (acute chest pain or equivalent and/or elevated troponin levels, and/or ischemic electrocardiographic changes except for persistent ST elevation) were included. Among 404 consecutive patients, 396 (98%) had available data for all prognostic variables required for calculation of the GRACE 2.0 score. The cohort for 1-year mortality did not include patients who died in hospital (n=8), thus, the final cohorts for predicting in-hospital and 1-year mortality consisted of 396 and 388 patients, respectively. Demographic and clinical data, including previous medical history and risk factors, were also documented. The decision on management strategy (conservative vs. invasive) was at the physician's discretion. All patients were followed for one year or until death. All gave informed consent. The study was approved by the Institutional Review Board, and complied with the Declaration of Helsinki.
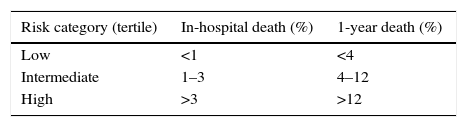
Calculation of risk of deathThe GRACE 2.0 ACS Risk Calculator, available online, was used for calculation.25 It uses eight prognostic variables: age, heart rate, systolic blood pressure, ST-segment deviation, Killip class, cardiac arrest at admission, serum creatinine and elevated cardiac biomarkers. If Killip class or serum creatinine levels are not available, diuretic use and renal failure can be substituted.24 Because risk stratification is important for management strategy, patients were stratified into three risk categories: low, intermediate, and high risk (Table 1). Observed in-hospital and 1-year mortality rates were assessed and then compared to predicted mortality rates for each risk category. If the predicted 1-year mortality was given as a range (e.g. 5%–6%) in the calculator, the lower result (i.e. 5%) was used.24 In addition, 1-year mortality rates were also assessed according to the final management option, irrespective of their conformity to the initial risk category.
Statistical analysisAll analyses were carried out using SPSS 18.0 for Windows (SPSS Inc., Chicago, Illinois, USA). Continuous variables were defined as mean ± standard deviation or as median (interquartile range), and categorical variables were defined as percentages. Continuous variables were assessed for normal distribution using Kolmogorov-Smirnov statistics.
The main outcome measure was the discrimination and calibration performance of GRACE 2.0. The discrimination of the model was analyzed by calculating the area under the receiver operating characteristic curve (AUC or c-statistic), which represented the accuracy of each value in discriminating survivors from non-survivors. It was classified as ‘good’ if AUC ≥0.70, and ‘inadequate’ if AUC <0.70.26 Calibration was evaluated by the Hosmer-Lemeshow goodness-of-fit test.27 If the Hosmer-Lemeshow p-value was >0.05, this denoted that there was no difference between predicted and observed values, indicating the model had a good fit. Conversely, a p-value <0.05 signaled inadequate calibration.
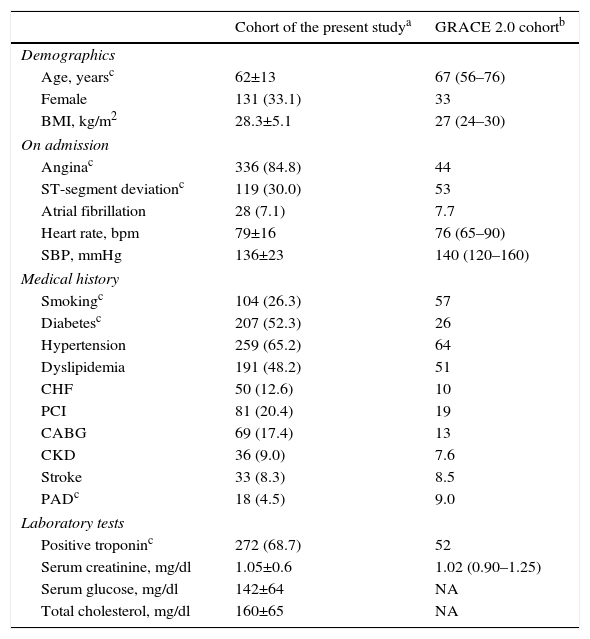
ResultsThe baseline characteristics of the study population are presented in Table 2, together with those of the original cohort used to develop GRACE 2.0. Among 396 patients, 270 (68%) had NSTEMI and 126 (32%) had UA. There were eight (2%) in-hospital deaths, all from cardiovascular cause. By one year after discharge, 48 (12.4%) patients had died; of these, 41 (10.4%) had NSTEMI and 7 (1.8%) had UA.
Baseline characteristics of the study population compared with the derivation cohort for GRACE 2.0.
| Cohort of the present studya | GRACE 2.0 cohortb | |
|---|---|---|
| Demographics | ||
| Age, yearsc | 62±13 | 67 (56–76) |
| Female | 131 (33.1) | 33 |
| BMI, kg/m2 | 28.3±5.1 | 27 (24–30) |
| On admission | ||
| Anginac | 336 (84.8) | 44 |
| ST-segment deviationc | 119 (30.0) | 53 |
| Atrial fibrillation | 28 (7.1) | 7.7 |
| Heart rate, bpm | 79±16 | 76 (65–90) |
| SBP, mmHg | 136±23 | 140 (120–160) |
| Medical history | ||
| Smokingc | 104 (26.3) | 57 |
| Diabetesc | 207 (52.3) | 26 |
| Hypertension | 259 (65.2) | 64 |
| Dyslipidemia | 191 (48.2) | 51 |
| CHF | 50 (12.6) | 10 |
| PCI | 81 (20.4) | 19 |
| CABG | 69 (17.4) | 13 |
| CKD | 36 (9.0) | 7.6 |
| Stroke | 33 (8.3) | 8.5 |
| PADc | 18 (4.5) | 9.0 |
| Laboratory tests | ||
| Positive troponinc | 272 (68.7) | 52 |
| Serum creatinine, mg/dl | 1.05±0.6 | 1.02 (0.90–1.25) |
| Serum glucose, mg/dl | 142±64 | NA |
| Total cholesterol, mg/dl | 160±65 | NA |
BMI: body mass index; CABG: coronary artery bypass grafting; CHF: congestive heart failure; CKD: chronic kidney disease; NA: not available; PAD; peripheral arterial disease: PCI: percutaneous coronary intervention; SBP: systolic blood pressure.
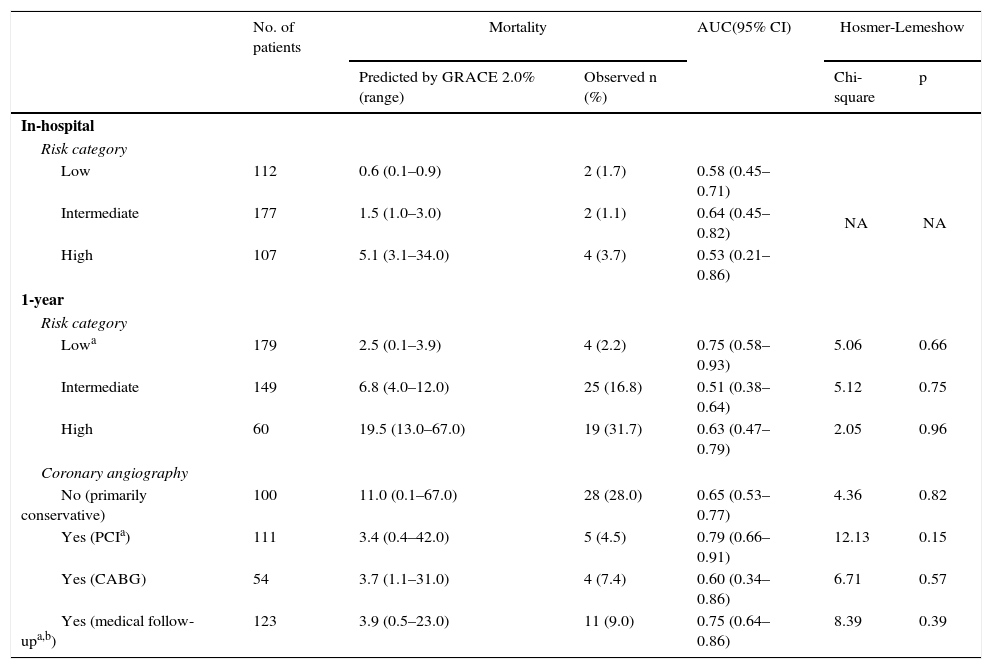
Table 3 presents the analysis of the model's discrimination and calibration performance, as outlined below.
Discrimination and calibration performance of GRACE 2.0.
| No. of patients | Mortality | AUC(95% CI) | Hosmer-Lemeshow | |||
|---|---|---|---|---|---|---|
| Predicted by GRACE 2.0% (range) | Observed n (%) | Chi-square | p | |||
| In-hospital | ||||||
| Risk category | ||||||
| Low | 112 | 0.6 (0.1–0.9) | 2 (1.7) | 0.58 (0.45–0.71) | NA | NA |
| Intermediate | 177 | 1.5 (1.0–3.0) | 2 (1.1) | 0.64 (0.45–0.82) | ||
| High | 107 | 5.1 (3.1–34.0) | 4 (3.7) | 0.53 (0.21–0.86) | ||
| 1-year | ||||||
| Risk category | ||||||
| Lowa | 179 | 2.5 (0.1–3.9) | 4 (2.2) | 0.75 (0.58–0.93) | 5.06 | 0.66 |
| Intermediate | 149 | 6.8 (4.0–12.0) | 25 (16.8) | 0.51 (0.38–0.64) | 5.12 | 0.75 |
| High | 60 | 19.5 (13.0–67.0) | 19 (31.7) | 0.63 (0.47–0.79) | 2.05 | 0.96 |
| Coronary angiography | ||||||
| No (primarily conservative) | 100 | 11.0 (0.1–67.0) | 28 (28.0) | 0.65 (0.53–0.77) | 4.36 | 0.82 |
| Yes (PCIa) | 111 | 3.4 (0.4–42.0) | 5 (4.5) | 0.79 (0.66–0.91) | 12.13 | 0.15 |
| Yes (CABG) | 54 | 3.7 (1.1–31.0) | 4 (7.4) | 0.60 (0.34–0.86) | 6.71 | 0.57 |
| Yes (medical follow-upa,b) | 123 | 3.9 (0.5–23.0) | 11 (9.0) | 0.75 (0.64–0.86) | 8.39 | 0.39 |
AUC: area under the receiver operating characteristic curve; CABG: coronary artery bypass grafting; CI: confidence interval; NA: not applicable; PCI: percutaneous coronary intervention.
In terms of discrimination performance, the AUC for predicting in-hospital mortality was <0.70 for each risk category as well as for the overall cohort, denoting inadequate discrimination (Figure 1).

Calibration performance was not reported because it would be misleading when >20% of the cells of the two-way table have expected frequencies of <5, as in this case.28
At one yearWhen applied to the overall cohort, the discrimination performance was good (AUC=0.77). However, subgroup analysis revealed differences: discrimination performance was good (AUC ≥0.70) only for low-risk patients, but was inadequate (AUC <0.70) for intermediate- to high-risk patients. When it was assessed according to the final management option, it was good (AUC ≥0.70) for patients who underwent percutaneous coronary intervention (PCI) or who required only medical follow-up after diagnostic coronary angiography (CAG). However, it was inadequate (AUC <0.70) for patients who did not undergo CAG or who underwent coronary artery bypass grafting (CABG).
The Hosmer-Lemeshow p-values for all subgroups were >0.05, suggesting a good model fit.
DiscussionThe present study is the first to assess the validity of the GRACE 2.0 risk predictor in a contemporary cohort of patients with NSTE-ACS. The results for in-hospital mortality were inconclusive. Because in-hospital death was observed in a small number of patients (8/396), application of the Hosmer-Lemeshow test was not appropriate. The same factor could also be responsible for the inadequate discrimination for hospital mortality. At one year, calibration performance was good for both the overall cohort and the subgroups classified according to their initial risk category or final management option (Figure 1 and Table 3). On the other hand, although the discrimination performance was good when applied to the overall cohort, different results were observed for the subgroups; it was only accurate for low-risk patients, whereas a tendency to underestimate mortality risk among intermediate- to high-risk patients was observed at one year. This underestimation by GRACE 2.0 might be partly related to differences in the underlying reasons for categorizing patients as high risk (e.g. a 90-year-old patient with left ventricular ejection fraction of 15% vs. a young patient in cardiac arrest). It is also clear that not all variables that might have an impact on prognosis are necessarily included in GRACE 2.0, such as adherence to guideline-directed medical therapy, which in the present study was comparable to previous European and US studies (Supplementary Table).3,29–31 Therefore, it should be emphasized that risk prediction tools can support but not replace sound clinical judgment. There are other potential explanations for the different observations, especially for the subgroups. The reason for inadequate discrimination performance at one year in patients who underwent CABG might be the low number of deaths observed (only 4/54). In other patients, the good discrimination performance obtained may be related to the appropriateness of proceeding with PCI (e.g. to opt for revascularization of ischemia-producing lesions with prognostic significance, such as in the proximal left anterior descending artery, or for medical management in non-ischemic lesions).
In contrast to the previous version of the GRACE score, the new version provides better accuracy and predicts mortality directly. In other words, GRACE 2.0 improves scores because predicted mortality has a non-linear relationship with score.24 Thus, in the present study, the outputs were given in terms of probability of dying as a ‘percentage’ instead of a ‘score’, and the model was designated the ‘GRACE 2.0 risk predictor’ instead of ‘GRACE 2.0 risk score’.
Because every population has its unique characteristics and the present study took place in a different patient population, the baseline characteristics of both the present study's cohort and the original GRACE 2.0 cohort are provided in Table 2. The GRACE 2.0 cohort had the following characteristics more frequently than that of the present study: advanced age, ST-segment deviation, smoking, and peripheral arterial disease. In contrast, patients presenting with angina, diabetes and/or elevated troponin were more common in the present study. These differences make direct comparison difficult, highlight the importance of conducting validation studies in different patient populations, and may be a potential explanation for the discrepancy observed between the results of this validation study and the GRACE 2.0 study. It should be emphasized that the different results obtained from the present study do not imply that GRACE 2.0 is an inaccurate risk predictor; they only mean that the risk predictor was applied in a different patient population.
Several studies have been conducted regarding validation of the previous risk score (GRACE 1.0) in different populations, in different countries and with different types of ACS and different follow-up periods (in-hospital, six months, and/or one year).4,5,7–23 After an extensive analysis of the literature, Khalill et al. concluded that GRACE 1.0 was better than other risk scores, simpler to use, and a powerful predictor of adverse outcomes in patients with ACS.6 However, application of GRACE 1.0 may nowadays be limited. First, most of these validation studies10–12,14 were conducted before 2002, and since then, management of ACS has changed considerably. Second, some more contemporary studies4,13,16,17,20–23 only reported in-hospital mortality. Finally, some studies12,15,22 did not report calibration performance. The latter is important because, as well as having a good discrimination performance, a model is expected to have an adequate level of calibration.26–28 The two are complementary, as discrimination reflects the risk predictor's ability to individually distinguish patients who will experience the outcome (e.g. death, in this case) from patients who will not, whereas calibration reflects the risk predictor's ability to predict death in a given population on the basis of a collective estimate rather than an individual one. The above-mentioned shortcomings were not identified in four studies7,8,18,19 which supported the accuracy of GRACE 1.0 for the prediction of six-month mortality.
To date, there have been two studies on external validation of the new GRACE 2.0: the FAST-MI 2005 registry and a study by Fujii et al.32,33 FAST-MI included patients with NSTEMI and ST-elevation myocardial infarction (STEMI) (i.e. UA was excluded), and was the basis for the prediction of 3-year mortality in the development of GRACE 2.0. In this registry, AUCs of 0.83 and 0.82 for the overall cohort were reported, indicating excellent discrimination at one and three years, respectively. However, it should be noted that the May-Hosmer goodness-of-fit p-value for one-year mortality was less than 0.001. Despite unfavorable calibration performance at one year, the p-value for three-year mortality was 0.60, indicating improved calibration performance over time. In the other study, Fujii et al. enrolled patients with STEMI (i.e. both UA and NSTEMI were excluded). They reported excellent discrimination performance with AUCs of 0.95 and 0.92 for in-hospital and one-year mortality, respectively, but did not report calibration performance.
The proportion of patients who underwent CAG in the present study was 25% (15/60) and 66% (99/149) for high-risk and intermediate-risk patients, respectively. In contrast, 92% (164/179) of low-risk patients underwent CAG. It should be noted that the ages of high-risk patients were ≥85 years in 21 patients, 80–84 in 16, 70–79 in 21, and <70 in only two patients, which could partially explain the reluctance of clinicians to proceed with an invasive procedure in these patient groups. However, the justification for the higher rate of CAG among low-risk patients even than among intermediate-risk patients was not apparent. One reason for this discrepancy may be the phenomenon known as the ‘treatment-risk paradox’ (i.e. most interventions were performed in low-risk rather than high-risk patients).12,34 The treatment-risk paradox is a common issue in current practice, and was seen even in the original GRACE registry.34 The source of the paradox is not known,35 but it might be partly explained by the fact that it is difficult for the clinician to weigh potential benefits against potential hazards. Additional considerations may include defensive medicine (practiced to protect against possible litigation), financial incentives, framing effects, blind obedience, inefficient processes and communication obstacles, and system errors (including problems with policies and procedures).36
Study limitationsThis was a single-center study. The sample size was relatively small; however, it was adequate for performing AUC analysis and assessing goodness-of-fit in terms of accurate statistical applications. GRACE 2.0 is the established model not only for NSTE-ACS but also STEMI. Thus, it may be inappropriate to extrapolate the results to those with STEMI. The results may also differ in different healthcare settings and different geographic locations. In addition, we did not calculate the probability of death/myocardial infarction at one year, or death or death/myocardial infarction at three years. It was difficult for us to monitor patients for myocardial infarction, in contrast to the precise determination of death. We focused on the probability of death at one year, because the data for the 1-year death model is more recent and more abundant.24 Finally, because ‘elevated troponin’ is a variable in the risk calculator, the type of assay used (i.e. highly sensitive vs. conventional assay) might have had an impact on the calculation of risk. The latter was used for both the present cohort and the GRACE 2.0 cohort. The precise role of highly sensitive assays in primary risk assessment remains unknown at present.37
ConclusionsIn a contemporary cohort of NSTE-ACS patients, the GRACE 2.0 score was valid for 1-year mortality assessment. Its value for in-hospital mortality requires validation in a larger cohort.
Ethical disclosuresProtection of human and animal subjectsThe authors declare that the procedures followed were in accordance with the regulations of the relevant clinical research ethics committee and with those of the Code of Ethics of the World Medical Association (Declaration of Helsinki).
Confidentiality of dataThe authors declare that no patient data appear in this article.
Right to privacy and informed consentThe authors have obtained the written informed consent of the patients or subjects mentioned in the article. The corresponding author is in possession of this document.
FundingNone declared.
Conflicts of interestThe authors have no conflicts of interest to declare.
We thank Prof. Cengizhan Acikel and Prof. Sibel Kiran for their intellectual and technical support in the statistical analysis of the data.
Comparison of adherence to the guideline-directed medical therapy (%).
