


Obesity is associated with high rates of dyslipidemia and glucose intolerance. The objective of this study was to evaluate the correlation of anthropometric indices with the lipid and glucose profiles of outpatients.
MethodsWe performed a cross-sectional study assessing anthropometric and metabolic parameters in a sample of 550 individuals.
ResultsThe prevalence of overweight exceeded 80%, with no difference between the sexes. However, 80.9% of women vs. 52.1% of men had waist circumference (WC) in the very high risk range (p=0.000). Glucose and lipid abnormalities were found in over 40% of the sample. In men, no correlation was found between anthropometric indices and metabolic profile. In women, HDL cholesterol (HDL-C) was negatively correlated with body mass index (BMI), WC and waist-to-height ratio (WHR). Triglycerides were positively correlated with BMI, WC and WHR and fasting plasma glucose with WC and WHR. After adjustment for age and nutritional status, the correlations only remained significant between HDL-C and anthropometric indices.
ConclusionsAmong women, the anthropometric indices WC, WHR and BMI proved good predictors of HDL-C, showing the importance of using these parameters in clinical practice and for screening of cardiovascular risk.
A obesidade está associada a elevada frequência de dislipidemias e intolerância à glicose. O objetivo desse estudo foi avaliar a correlação de índices antropométricos com o perfil lipídico e glicídico de pacientes ambulatoriais.
MétodosEstudo transversal envolvendo uma amostra de 550 indivíduos, em que foram avaliados parâmetros antropométricos e metabólicos.
ResultadosA prevalência de excesso de peso superou 80%, não ocorrendo diferencial entre os sexos. No entanto, 80,9% das mulheres contra 52,1% dos homens apresentaram circunferência da cintura (CC) na faixa de risco muito elevado (p=0.000). Alterações lipídicas e glicídicas foram encontradas em mais de 40% da amostra. No sexo masculino, não foi evidenciada nenhuma correlação entre os índices antropométricos e o perfil metabólico. Para as mulheres, o HDL colesterol (HDL-c) apresentou correlação negativa com o índice de massa corporal (IMC), CC e relação cintura estatura (RCEst). O triglicerídeo (TG) apresentou correlação positiva com o IMC, CC e RCEst e a glicemia de jejum (GJ) com a CC e RCEst. Na análise ajustada para idade e estado nutricional, as correlações permaneceram significativas apenas entre HDL-c e os índices antropométricos.
ConclusõesEntre as mulheres, os índices antropométricos CC, RCEst e IMC mostraram-se bons preditores das concentrações de HDL-c, evidenciando a importância da utilização desses parâmetros na prática clínica e no rastreamento do risco cardiovascular.
Cardiovascular disease (CVD) is the leading cause of mortality and morbidity in adults; it is responsible for 16.7 million deaths per year worldwide according to the World Health Organization (WHO). In Brazil, around 30% of deaths in individuals aged over 20 are the result of CVD.1
There are many risk factors for the development of CVD, some of which, such as age, gender, family history and genetic inheritance,2,3 cannot be modified, but others are directly linked to lifestyle and are modifiable, including smoking, physical inactivity, poor diet, obesity and dyslipidemia.2,4
Studies have shown that excess adipose tissue, particularly central obesity, is associated with high cardiovascular morbidity and mortality.5,6 Abnormal visceral fat produces physiological changes that alter lipid profile, leading to dyslipidemia, which in turn increases the risk of cardiovascular events.7 This is particularly true of alterations in low-density lipoprotein cholesterol (LDL-C), an independent causal factor in atherosclerosis,4 and changes in vascular permeability arising from impaired glucose metabolism.8
Different methods are used to assess amount and distribution of body fat and its relationship to CVD. The anthropometric parameters body mass index (BMI), waist circumference (WC) and waist-to-height ratio (WHR) have the advantages in daily clinical practice of being simple to measure and reproducible.9,10 The objective of this study was to evaluate the correlation between lipid and glucose profiles and anthropometric indices of total and central obesity, in order to determine which of the anthropometric measures commonly used in clinical practice and epidemiological studies are the best predictors of changes in lipid and glucose profiles.
MethodsThis was a cross-sectional study of individuals attending outpatient consultations on nutrition at the Hospital Barão de Lucena (HBL) and Hospital das Clínicas (HC), part of the public health network of the city of Recife in north-eastern Brazil, between January and December 2009.
We analyzed 550 outpatients of both sexes aged over 19 seeking advice on nutrition. Patients were excluded if they were pregnant, had wasting diseases such as cancer or AIDS, had been taking medication for dyslipidemia, hyperglycemia or weight loss in the previous six months or had undergone plastic surgery such as abdominoplasty, as were those with conditions that could change body fat distribution.
As this was a survey aimed at determining the correlation between anthropometric indices and lipid and glucose profiles in outpatients before they received medical treatment or nutritional advice, only those who had not previously received professional advice on weight loss, dyslipidemia or hyperglycemia were selected.
Sociodemographic and anthropometric data (age, gender, educational level, weight, height and waist circumference) were recorded by the two attending physicians on a specially designed questionnaire.
For measurement of weight and height, the two out-patient clinics followed the methods recommended by Lohman et al.,11 using platform scales (capacity 150 kg in 100-g divisions) with stadiometer (in 1-mm divisions). Weight and height were then used to calculate BMI, using the classification proposed by the WHO (1995).12 WC was measured with a non-stretch tape measure according to the standards and cut-offs recommended by the WHO (1998).13 WHR was determined as the ratio between WC in cm and height in cm, 0.5 being used as the cut-off.14
Biochemical assessment included fasting plasma glucose (FPG), total cholesterol (TC), triglycerides (TG), LDL-C and high-density lipoprotein cholesterol (HDL-C). The analyses were performed in the two hospitals’ laboratories using automated analyzers: COBAS INTEGRA 400 Plus (Roche) and ARCHITECT in HBL and HC, respectively, for lipid profile; and enzymatic colorimetric methods in HBL and DiaSys/ARCHITECT in HC for FPG.
The reference lipid values used were those published in the IV Brazilian Guideline for Dyslipidemia and Atherosclerosis Prevention of the Brazilian Society of Cardiology (2007).4 The cut-offs for FPG were based on the criteria of the American Diabetics Association (2008),15 values between 100 and 125 mg/dl indicating glucose intolerance and values over 126 mg/dl indicating diabetes.
Statistical analysisThe database was constructed using Epi Info version 6.04 software with double data entry and use of the Validate module to check for errors in data entry. Continuous variables were tested for normality of distribution by the Kolmogorov-Smirnov test. As none presented a normal distribution, they were converted to their natural logarithms and tested again, after which all anthropometric and lipid parameters showed normal distribution except TC and FPG. Pearson's correlation coefficient was then used to assess the correlation between lipid and glucose parameters and anthropometric indices after adjustment for possible confounding variables including age and nutritional status.
The study protocol was approved by the Research Ethics Committee of the Center for Health Sciences of the Universidade Federal de Pernambuco.
ResultsWe analyzed 550 patients (76.4% women), median age 51 years (P25: 41, P75: 59), 67.6% with less than eight years’ schooling, who were seeking nutritional advice mainly for the purpose of losing weight.
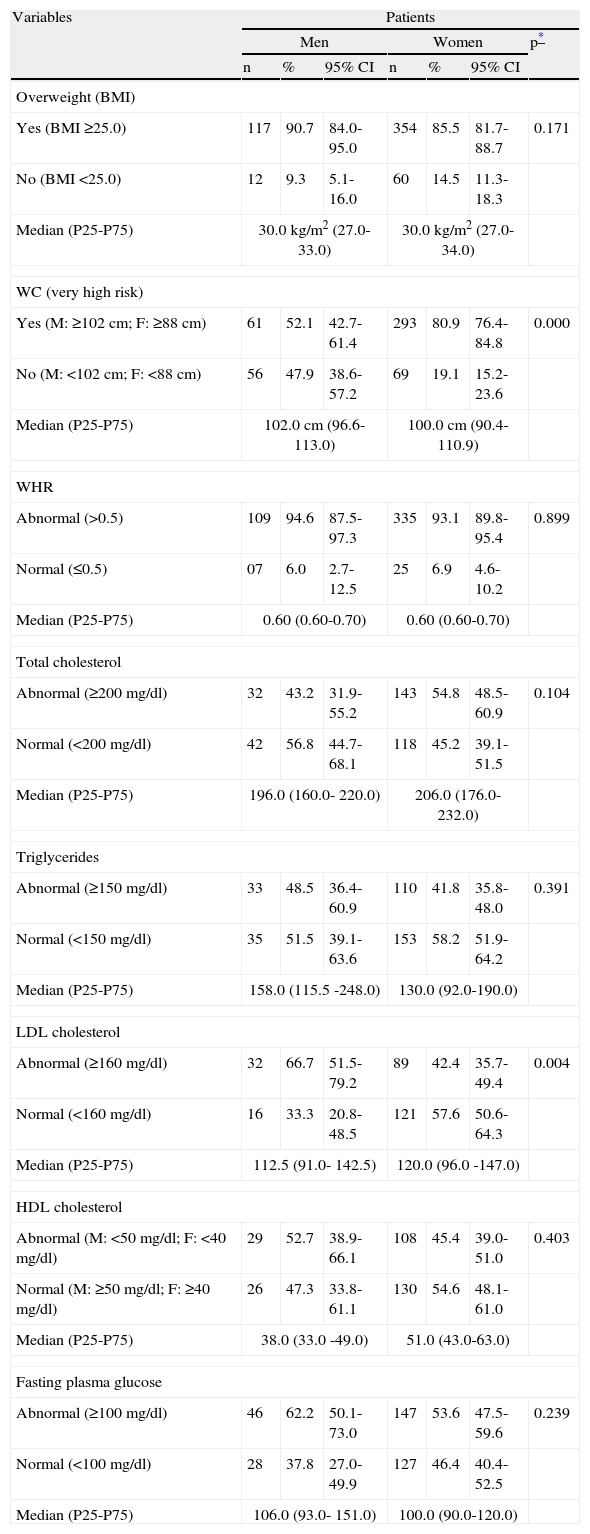
On the basis of BMI, there was a high prevalence of overweight (over 80%), with no significant difference between the sexes (p=0.171). A similar result was found for WHR, with over 90% of the study population presenting abnormal values, again with no gender difference (p=0.899). By contrast, 80.9% of women vs. 52.1% of men had WC in the very high risk range (p=0.000) (Table 1).
Distribution in percentages, medians and interquartile ranges of anthropometric and laboratory parameters of individuals attending outpatient nutrition clinics in Recife, north-eastern Brazil, in 2009.
| Variables | Patients | ||||||
| Men | Women | p* | |||||
| n | % | 95% CI | n | % | 95% CI | ||
| Overweight (BMI) | |||||||
| Yes (BMI ≥25.0) | 117 | 90.7 | 84.0-95.0 | 354 | 85.5 | 81.7-88.7 | 0.171 |
| No (BMI <25.0) | 12 | 9.3 | 5.1-16.0 | 60 | 14.5 | 11.3-18.3 | |
| Median (P25-P75) | 30.0 kg/m2 (27.0-33.0) | 30.0 kg/m2 (27.0-34.0) | |||||
| WC (very high risk) | |||||||
| Yes (M: ≥102 cm; F: ≥88 cm) | 61 | 52.1 | 42.7-61.4 | 293 | 80.9 | 76.4-84.8 | 0.000 |
| No (M: <102 cm; F: <88 cm) | 56 | 47.9 | 38.6-57.2 | 69 | 19.1 | 15.2-23.6 | |
| Median (P25-P75) | 102.0 cm (96.6-113.0) | 100.0 cm (90.4-110.9) | |||||
| WHR | |||||||
| Abnormal (>0.5) | 109 | 94.6 | 87.5-97.3 | 335 | 93.1 | 89.8-95.4 | 0.899 |
| Normal (≤0.5) | 07 | 6.0 | 2.7-12.5 | 25 | 6.9 | 4.6-10.2 | |
| Median (P25-P75) | 0.60 (0.60-0.70) | 0.60 (0.60-0.70) | |||||
| Total cholesterol | |||||||
| Abnormal (≥200 mg/dl) | 32 | 43.2 | 31.9-55.2 | 143 | 54.8 | 48.5-60.9 | 0.104 |
| Normal (<200 mg/dl) | 42 | 56.8 | 44.7-68.1 | 118 | 45.2 | 39.1-51.5 | |
| Median (P25-P75) | 196.0 (160.0- 220.0) | 206.0 (176.0- 232.0) | |||||
| Triglycerides | |||||||
| Abnormal (≥150 mg/dl) | 33 | 48.5 | 36.4-60.9 | 110 | 41.8 | 35.8-48.0 | 0.391 |
| Normal (<150 mg/dl) | 35 | 51.5 | 39.1-63.6 | 153 | 58.2 | 51.9-64.2 | |
| Median (P25-P75) | 158.0 (115.5 -248.0) | 130.0 (92.0-190.0) | |||||
| LDL cholesterol | |||||||
| Abnormal (≥160 mg/dl) | 32 | 66.7 | 51.5-79.2 | 89 | 42.4 | 35.7-49.4 | 0.004 |
| Normal (<160 mg/dl) | 16 | 33.3 | 20.8-48.5 | 121 | 57.6 | 50.6-64.3 | |
| Median (P25-P75) | 112.5 (91.0- 142.5) | 120.0 (96.0 -147.0) | |||||
| HDL cholesterol | |||||||
| Abnormal (M: <50 mg/dl; F: <40 mg/dl) | 29 | 52.7 | 38.9-66.1 | 108 | 45.4 | 39.0-51.0 | 0.403 |
| Normal (M: ≥50 mg/dl; F: ≥40 mg/dl) | 26 | 47.3 | 33.8-61.1 | 130 | 54.6 | 48.1-61.0 | |
| Median (P25-P75) | 38.0 (33.0 -49.0) | 51.0 (43.0-63.0) | |||||
| Fasting plasma glucose | |||||||
| Abnormal (≥100 mg/dl) | 46 | 62.2 | 50.1-73.0 | 147 | 53.6 | 47.5-59.6 | 0.239 |
| Normal (<100 mg/dl) | 28 | 37.8 | 27.0-49.9 | 127 | 46.4 | 40.4-52.5 | |
| Median (P25-P75) | 106.0 (93.0- 151.0) | 100.0 (90.0-120.0) | |||||
The total number of individuals differs for each variable due to availability of data. BMI: body mass index; CI: confidence interval; F: females; M: males; WC: waist circumference; WHR: waist-to-height ratio.
With regard to the laboratory parameters assessed (Table 1), abnormal levels for TC, TG, LDL-C, HDL-C and FPG were found in over 40% of the sample. The only statistically significant difference between the sexes was for LDL-C, with 66.7% of men vs. 42.4% of women presenting elevated levels (p=0.004).
Based on reference values for BMI, WC and WHR, both men and women presented at-risk values, with median BMI classified as borderline obesity and median WC in the very high risk range. In terms of lipid and glucose profiles, median values for all parameters, with the exception of HDL-C in women, fell within the at-risk range (Table 1).
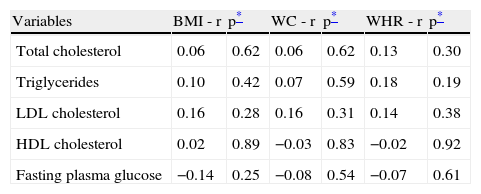
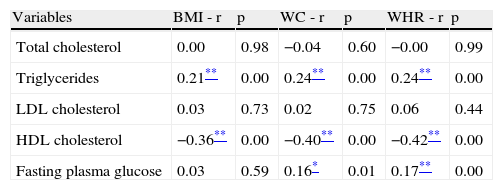
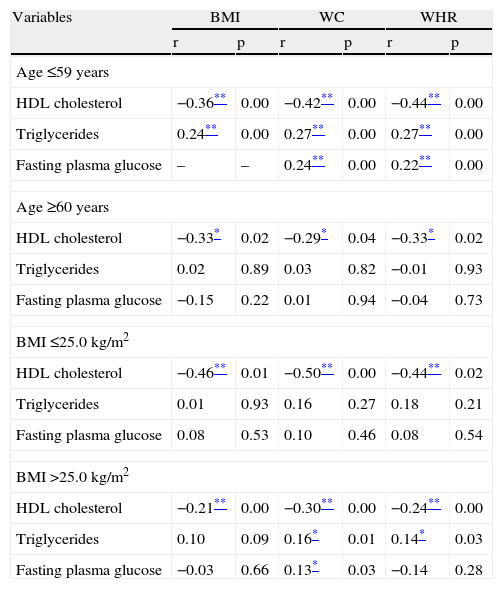
Correlations between anthropometric parameters and lipid and glucose profiles for men and women are presented in Tables 2 and 3, respectively. No correlation was found between anthropometric indices and metabolic profile in men (Table 2). In women, HDL-C was negatively correlated with BMI (r=−0.36), WC (r=−0.40) and WHR (r=−0.42), while triglycerides were positively correlated with BMI (r=0.21), WC (r=0.24) and WHR (r=0.24) and FPG with WC (r=0.16) and WHR (r=0.17) (Table 3). After adjustment for age and nutritional status, the correlations only remained significant between HDL-C and anthropometric indices (Table 4).
Correlations between anthropometric variables and metabolic profile in men attending outpatient nutrition clinics in Recife, north-eastern Brazil, in 2009.
| Variables | BMI - r | p* | WC - r | p* | WHR - r | p* |
| Total cholesterol | 0.06 | 0.62 | 0.06 | 0.62 | 0.13 | 0.30 |
| Triglycerides | 0.10 | 0.42 | 0.07 | 0.59 | 0.18 | 0.19 |
| LDL cholesterol | 0.16 | 0.28 | 0.16 | 0.31 | 0.14 | 0.38 |
| HDL cholesterol | 0.02 | 0.89 | −0.03 | 0.83 | −0.02 | 0.92 |
| Fasting plasma glucose | −0.14 | 0.25 | −0.08 | 0.54 | −0.07 | 0.61 |
BMI: body mass index; WC: waist circumference; WHR: waist-to-height ratio.
Correlations between anthropometric variables and metabolic profile in women attending outpatient nutrition clinics in Recife, north-eastern Brazil, in 2009.
| Variables | BMI - r | p | WC - r | p | WHR - r | p |
| Total cholesterol | 0.00 | 0.98 | −0.04 | 0.60 | −0.00 | 0.99 |
| Triglycerides | 0.21** | 0.00 | 0.24** | 0.00 | 0.24** | 0.00 |
| LDL cholesterol | 0.03 | 0.73 | 0.02 | 0.75 | 0.06 | 0.44 |
| HDL cholesterol | −0.36** | 0.00 | −0.40** | 0.00 | −0.42** | 0.00 |
| Fasting plasma glucose | 0.03 | 0.59 | 0.16* | 0.01 | 0.17** | 0.00 |
BMI: body mass index; WC: waist circumference; WHR: waist-to-height ratio.
Correlations between anthropometric variables and metabolic profile, adjusted for age and nutritional status, in women attending outpatient nutrition clinics in Recife, north-eastern Brazil, in 2009.
| Variables | BMI | WC | WHR | |||
| r | p | r | p | r | p | |
| Age ≤59 years | ||||||
| HDL cholesterol | −0.36** | 0.00 | −0.42** | 0.00 | −0.44** | 0.00 |
| Triglycerides | 0.24** | 0.00 | 0.27** | 0.00 | 0.27** | 0.00 |
| Fasting plasma glucose | – | – | 0.24** | 0.00 | 0.22** | 0.00 |
| Age ≥60 years | ||||||
| HDL cholesterol | −0.33* | 0.02 | −0.29* | 0.04 | −0.33* | 0.02 |
| Triglycerides | 0.02 | 0.89 | 0.03 | 0.82 | −0.01 | 0.93 |
| Fasting plasma glucose | −0.15 | 0.22 | 0.01 | 0.94 | −0.04 | 0.73 |
| BMI ≤25.0 kg/m2 | ||||||
| HDL cholesterol | −0.46** | 0.01 | −0.50** | 0.00 | −0.44** | 0.02 |
| Triglycerides | 0.01 | 0.93 | 0.16 | 0.27 | 0.18 | 0.21 |
| Fasting plasma glucose | 0.08 | 0.53 | 0.10 | 0.46 | 0.08 | 0.54 |
| BMI >25.0 kg/m2 | ||||||
| HDL cholesterol | −0.21** | 0.00 | −0.30** | 0.00 | −0.24** | 0.00 |
| Triglycerides | 0.10 | 0.09 | 0.16* | 0.01 | 0.14* | 0.03 |
| Fasting plasma glucose | −0.03 | 0.66 | 0.13* | 0.03 | −0.14 | 0.28 |
BMI: body mass index; WC: waist circumference; WHR: waist-to-height ratio.
The data presented here relate to a specific population of individuals seeking nutritional advice mainly to lose weight, which explains the more than 80% prevalence of overweight. Some had been referred to the outpatient clinics merely to lose weight while others had problems associated with overweight, including changes in blood pressure and lipid and glucose profiles, as well as conditions of a rheumatological or orthopedic nature.
The predominance of women in our study population (76.4%) is probably related to the fact that women are generally more concerned about their health and thus more likely to use the health services.16,17 The main non-modifiable risk factor for CVD is age; vascular endothelial damage becomes more apparent from the third decade of life and its clinical consequences begin around the age of 40.18,19 The median age of our sample was 51, which means primary prevention of CVD would be more difficult since such measures should have begun earlier. Studies have shown that the fatty streaks that are the precursors of atherosclerotic plaques begin to form in childhood,20 and can already be found in the abdominal aorta and coronary arteries of adolescents.
The low educational level observed in both sexes in our sample may indicate poor understanding of the problems associated with obesity. The high proportion of individuals seeking advice on weight loss reflects the epidemic of overweight afflicting the Brazilian adult population. The 2008-2009 Family Budget Survey21 revealed that 50.1% of men and 48% of women in Brazil are overweight, which highlights the importance of nutritional intervention, especially since overweight is a modifiable risk factor for CVD.
The high prevalence of very high WC in our study population, especially among women, may be explained by their seven-fold greater risk of developing central obesity.22 A study by Pischon et al.23 showed that each 5 cm above WC reference values increases cardiovascular risk by 13% in women and 17% in men. However, Sánchez et al.24 found that in general women have more subcutaneous fat in the abdominal region, while men tend to have more visceral adipose tissue, which may explain their higher risk for non-transmissible chronic diseases since visceral fat has greater pro-inflammatory characteristics than subcutaneous fat.25
The present study found that over 40% of the sample had abnormal values for all components of the lipid and glucose profiles, with no statistically significant differences between the sexes except for a higher prevalence of elevated LDL-C in men. These results reflect the situation in the adult population as reported by the III Brazilian National Survey on Health and Nutrition (III PESN)26 (2006), which found that over 30% of individuals aged over 25 presented abnormal TC and TG, and 16% had elevated FPG. Another worrying fact reported by III PESN was that little more than half of those interviewed had undergone tests to determine their lipid and glucose profiles, which highlights the need for earlier diagnosis in view of the associated increase in CVD risk.
Various studies have sought to determine which anthropometric parameter best identifies high cardiovascular risk,27,28 but few have assessed populations attending outpatient clinics.29,30
In general, our study found no strong correlations between anthropometric indices of general and central obesity and lipid and glucose profiles, which is in agreement with other studies.31,32
The lack of correlation between metabolic profile and anthropometric variables in men was unexpected. Abdominal fat in women tends to be in subcutaneous tissue, representing a lower risk, but a strong correlation would be expected in men since they tend to accumulate more visceral fat and hence are at greater risk. In addition, 65.7% of the women assessed were aged over 45, which means that many were pre-menopausal, menopausal or post-menopausal. The loss of ovarian function is known to be a determining factor in elevation of serum lipids in women33,34; studies have shown that serum levels of TC, LDL-C and TG can increase by up to 19% around the age of the menopause,33,35 possibly due to menopause- and age-related changes in BMI and body composition.36
After adjustment for age and nutritional status, the correlations only remained significant between HDL-C and anthropometric indices. Since HDL-C is known to play a role in preventing the formation of atheromatous plaques and hence cardiovascular events, these results indicate that anthropometric indices of general and central obesity could be used as predictors of abnormal HDL-C.
ConclusionAmong women, the anthropometric indices WC, WHR and BMI proved good predictors of HDL-C, showing the importance of using these parameters in clinical practice and for screening of cardiovascular risk. Prospective studies using different parameters to assess abdominal obesity and its relationship to metabolic profile are necessary to corroborate our findings. In addition, research focusing on those attending outpatient nutrition clinics is highly recommended as this population lends itself to cross-sectional longitudinal studies.
Ethical disclosuresProtection of human and animal subjectsThe authors declare that no experiments were performed on humans or animals for this study.
Confidentiality of dataThe authors declare that they have followed the protocols of their work center on the publication of patient data and that all the patients included in the study received sufficient information and gave their written informed consent to participate in the study.
Right to privacy and informed consentThe authors have obtained the written informed consent of the patients or subjects mentioned in the article. The corresponding author is in possession of this document.
Conflicts of interestThe authors have no conflicts of interest to declare.
Please cite this article as: Mota dos Santos C, et al. Perfil lipídico e glicídico de pacientes atendidos em ambulatório e sua correlação com índices antropométricos. Rev Port Cardiol. 2012. doi:10.1016/j.repc.2012.05.017.
Vinculação académica: este artigo é parte da dissertação de Mestrado de Nutrição de Cláudia Mota dos Santos pelo Programa de Pós-graduação em Nutrição (UFPE).

www.publicationethics.org.