


Cardiac computed tomography (CT) can provide a precise three-dimensional anatomic map and exclude intracardiac thrombus prior to atrial fibrillation (AF) ablation. We aimed to assess the impact of CT protocol optimization and technological advances on contrast and radiation doses and on image quality.
MethodsFrom a prospective registry of consecutive patients who underwent cardiac CT in a single center, 270 patients were selected in whom CT was performed for assessment prior to AF ablation, divided into three groups: Group 1: the first 150 patients included; Group 2: the last 60 patients assessed with the same CT scanner; Group 3: the first 60 exams performed with a new CT scanner. The quality of the protocol was evaluated based on radiation dose, contrast volume used, the need for a second (delayed) scan, and quantitative image quality analysis (signal-to-noise and contrast-to-noise ratios and the density homogeneity ratio between the left atrium and the left atrial appendage).
ResultsSignificant reductions were found in radiation and contrast doses between the first and last subgroups (Group 1: 5.6 mSv and 100 ml; Group 2: 1.3 mSv and 90 ml; Group 3: 0.6 mSv and 65 ml). Although radiation and contrast doses in Group 3 were lower, quantitative measures of image quality were still better (signal-to-noise 13.5; contrast-to-noise 14.8; density homogeneity ratio 0.92).
ConclusionProtocol optimization and technological advances both contributed to significantly lower radiation dose and contrast volume used in cardiac CT prior to AF ablation, without compromising image quality.
A capacidade de a TC cardíaca fornecer um mapa anatómico preciso e excluir a presença de trombo intracardíaco é conhecida. O objetivo deste estudo foi avaliar o impacto da otimização de protocolos e evolução tecnológica nas doses de radiação e contraste e na qualidade de imagem dos exames de TC cardíaca prévia a ablação de fibrilhação auricular (FA).
MétodosRegisto prospetivo de doentes consecutivos de centro único, foram incluídos os que fizeram TC cardíaca num contexto de avaliação prévia a ablação de FA (n=270), distribuídos em três grupos: Grupo 1, constituído pelos primeiros 150 doentes; Grupo 2, os últimos 60 doentes feitos no mesmo aparelho; Grupo 3, os primeiros 60 doentes do novo aparelho. Avaliámos a otimização do protocolo com base na dose de radiação, no volume de contraste, na necessidade de aquisição complementar e na avaliação objectiva da qualidade de imagem (rácios sinal/ruído, contraste/ruído e homogeneização de densidade AE/AAE).
ResultadosHouve uma redução significativa da radiação entre cada um dos grupos e da dose de contraste entre o primeiro e o último grupo (G1: 5,6 mSv e 100 ml; G2: 1,3 mSv e 90 ml; G3: 0,6 mSv e 65 ml). Apesar das menores doses de radiação e contraste, o Grupo 3 apresentou resultados significativamente melhores de qualidade de imagem (rácios sinal/ruído 13,5; contraste/ruído 14,8; homogeneização de densidade 0,92).
ConclusãoA otimização de protocolos e a evolução tecnológica permitiram reduções significativas nas doses de radiação e de contraste usadas na TC cardíaca pré-ablação de FA, sem prejudicar a qualidade de imagem.
Catheter ablation for pulmonary vein isolation has been the subject of significant clinical and technological advances in recent years1 and is now an established treatment for atrial fibrillation (AF). Before ablation is performed, it is necessary to exclude the presence of intracardiac thrombus, especially in the left atrial appendage (LAA).2–4 Three-dimensional anatomical mapping of the left atrium (LA) and the pulmonary veins prior to the procedure enhances safety, reduces radiation dose, and improves the accuracy of the procedure.5–8
Cardiac computed tomography (CT) can non-invasively provide all the information for anatomical mapping and exclusion of intracardiac thrombus (Figure 1),9 and has thus become the main imaging modality for patients undergoing AF ablation.10
 and left atrial appendage (LAA) by cardiac computed tomography. (1) Assessment of LAA patency; (2) assessment of LA morphology and pulmonary vein drainage; (3) detail of drainage of right inferior pulmonary vein; (4) detail of LAA morphology; (5) volumetric assessment of LA; (6) presence of a supernumerary pulmonary vein draining directly into the LA; (7) presence of a small accessory appendage. APENDICE ACESSORIO: accessory appendage; APENDICE AE: left atrial appendage; inf drt: right inferior pulmonary vein.")
Assessment of the left atrium (LA) and left atrial appendage (LAA) by cardiac computed tomography. (1) Assessment of LAA patency; (2) assessment of LA morphology and pulmonary vein drainage; (3) detail of drainage of right inferior pulmonary vein; (4) detail of LAA morphology; (5) volumetric assessment of LA; (6) presence of a supernumerary pulmonary vein draining directly into the LA; (7) presence of a small accessory appendage. APENDICE ACESSORIO: accessory appendage; APENDICE AE: left atrial appendage; inf drt: right inferior pulmonary vein.
We aimed to assess the impact of CT protocol optimization prior to AF ablation in terms of contrast and radiation doses and image quality, considering the increasing experience in our center, and technological advances.
MethodsStudy design and populationFrom a prospective registry11 of consecutive patients who underwent cardiac CT in a single large-volume center, all patients undergoing the procedure for pre-AF ablation assessment were selected. These were divided into three groups: Group 1: the first 150 patients included in the registry; Group 2: the last 60 patients assessed with the same CT scanner, a first-generation 64-slice dual-source SOMATOM Definition® (Siemens Healthcare); Group 3: the first 60 exams performed with a new CT scanner, a third-generation 192-slice dual-source SOMATOM Force® (Siemens Healthcare) (Figure 2). Group 1 constituted a control group for comparison with Group 2, in order to assess our experience with protocol optimization, while Group 2 was used as a control group for comparison with Group 3, to assess the effects of technological advances.
Scanning protocols
All exams were performed within 24 hours before the ablation procedure.
Group 1 scanning protocolThe exams in Group 1 used a first-generation 64-slice dual-source SOMATOM Definition®, with a native temporal resolution of 83 ms and scan speed of 458 mm/s. A retrospective protocol was used with tube current modulation, reducing tube current by 20% outside periods of maximum dose, the latter selected as follows: at 70% of the R-R interval if heart rate was regular and <70 bpm; at 40-80% of the R-R interval if regular and 70-80 bpm or arrhythmic; and 40-50% of the R-R interval if regular and >80 bpm.
Peak voltage was set at 100 kV for patients with body mass index (BMI) <30 kg/m2 and at 120 kV in other cases.
Images were reconstructed using filtered back projection (FBP), with slice thickness 1.5 mm, increment 0.7 mm and a 512×512 matrix.
The contrast used l (320 mg I/ml) was administered at a flow rate of 6 ml/s in three phases. The first phase was administration of undiluted contrast, with volume calculated as (scan time+delay time)×6(flow rate) and a delay time of 7 s. The second phase consisted of administration of 30 ml of dilute contrast (30% contrast and 70% saline) and the third consisted of 30 ml saline.
Bolus tracking was used with the region of interest in the ascending aorta and scanning began 7 s after a CT density of 150 Hounsfield units (HU) was achieved.
Group 2 scanning protocolThe exams in Group 2 used the same first-generation 64-slice SOMATOM Definition® as in Group 1.
A prospective protocol was used in patients with regular or arrhythmic heart rate and little R-R variability. In other cases a retrospective protocol was used with tube current modulation, reducing tube current by 20% outside periods of maximum dose, with the latter set at 40-80% of the R-R interval.
Peak voltage was set at 80 kV for patients with BMI <30 kg/m2, at 100 kV for body weight <100 kg and at 120 kV for body weight >100 kg.
Images were reconstructed as in Group 1, using FBP, with slice thickness 1.5 mm, increment 0.7 mm and a 512×512 matrix.
The contrast used (370 mg I/ml) was administered following the same protocol as in Group 1, except for a flow rate of 5 ml/s, the formula to calculate contrast volume, which was (scan time+delay time)×5(flow rate), and a delay time of 10 s. The second and third phases were as for Group 1.
Bolus tracking was used as for Group 1, with scanning initiated 10 s after a CT density of 150 HU was achieved.
Group 3 scanning protocolThe exams in Group 3 used a third-generation 192-slice dual-source SOMATOM Force®, with a native temporal resolution of 66 ms and scan speed in Flash mode of 737 mm/s. Flash mode (scanning in a single heartbeat at very high scan speed) was used in all cases except in patients with heart rate of over 80 bpm, in whom a prospective protocol was used, and in those with marked R-R variability, in whom a retrospective protocol was used.
Peak voltage and tube current per rotation were determined automatically based on the CT density of the topogram and reference parameters, which we selected as 80 kV and 200 mA, respectively. For patients with BMI >30 kg/m2 a tube current of 100 kV was used. The reference parameters were used to determine admissible and maximum noise levels, which were adjusted automatically by the scanner to optimize radiation dose while maintaining image quality.
Images were reconstructed using an iterative protocol (SAFIRE) at strength 3, with slice thickness 1.5 mm, increment 0.7 mm and a 512×512 matrix.
The same contrast (370 mg I/ml) was administered following the same protocol as in Group 2, except for a flow rate of 4 ml/s, the formula to calculate contrast volume, which was (scan time+delay time)×4(flow rate), and a delay time of 15 s, to compensate for the marked reduction in scan time when using Flash (less than 1 s). The second and third phases were as for Groups 1 and 2.
Bolus tracking was used as for Groups 1 and 2, with scanning initiated 15 s after a CT density of 150 HU was achieved.
Protocol optimization was assessed on the basis of the following parameters:
- •
radiation dose in mSv calculated from total dose length product (DLP), values of which were calculated automatically by the scanning equipment, multiplied by a conversion factor of 0.01412–14;
- •
contrast volume;
- •
a subjective evaluation of diagnostic quality, i.e. the ability to exclude thrombus in the LA and LAA, as appraised independently by two physicians with level III training in cardiac CT, as well as the number of patients in whom a second scan was considered necessary (without further contrast administration) to adequately image the LA and LAA;
- •
an objective evaluation of exam quality (between Groups 2 and 3), based on signal-to-noise and contrast-to-noise ratios and the density homogeneity ratio between the LA and the LAA.
The signal-to-noise ratio was obtained by describing a region of interest in the middle of the LA and dividing the mean CT density by the standard deviation (Figure 3).
 Region of interest (ROI) in the left atrium (LA); (B) ROI in the left atrial appendage (LAA); (C) ROI in the left ventricular (LV) wall. The signal-to-noise ratio was calculated as mean LA CT density/standard deviation of LA, and contrast-to-noise ratio as (mean LAA CT density-mean density of LV wall)/standard deviation of LAA. The contrast homogeneity ratio between the LA and the LAA was calculated as mean LA CT density/mean of the area of least CT density in the LAA.")
Calculation of signal-to-noise and contrast-to-noise ratios. (A) Region of interest (ROI) in the left atrium (LA); (B) ROI in the left atrial appendage (LAA); (C) ROI in the left ventricular (LV) wall. The signal-to-noise ratio was calculated as mean LA CT density/standard deviation of LA, and contrast-to-noise ratio as (mean LAA CT density-mean density of LV wall)/standard deviation of LAA. The contrast homogeneity ratio between the LA and the LAA was calculated as mean LA CT density/mean of the area of least CT density in the LAA.
In view of the need to exclude thrombus in exams of this type, the contrast-to-noise ratio was defined in terms of the CT density of left ventricular myocardium rather than epicardial fat, since the former borders the LAA and its CT density differs little from that of the LAA lumen. This parameter was calculated by describing regions of interest in the LAA (with less visual density) and the myocardial segment closest to the LAA, using the formula (mean LAA CT density - mean myocardial CT density)/standard deviation of the LAA. The contrast homogeneity ratio between the LA and the LAA was obtained by dividing the mean CT density of the LA at the region of interest placed at the site of greatest visual density by the mean density at the region of interest placed at the site of least visual density in the LAA (Figure 3).
Demographic and anthropometric characteristics of each group (gender, age, weight and height) were recorded for each group, as well as cardiac rhythm and rate (maximum, minimum and mean) during the scan, variables of the protocol used (retrospective, prospective or Flash, tube current, and DLP), atrial volume, the presence or otherwise of intracardiac thrombus, and thromboembolic complications between the ablation procedure and hospital discharge.
All exams were electrocardiogram (ECG)-gated, optimizing the protocol for each patient.
The exams were assessed immediately in order to decide whether there was a need for a second scan, which was performed if opacification of the LAA was deemed insufficient to exclude the presence of thrombus, or if the exam was not considered diagnostic for any other reason. The second scan was performed within 3 min of the first, without additional contrast, and imaging the LAA only (Figures 4 and 5).
. ETE: transesophageal echocardiography.")

Assessment of left atrial appendage: example of the need for a second scan to differentiate between true thrombus and pseudothrombus. The latter is identified by the gain in contrast in the delayed second scan, its mean density, and the similarity of its density to that of the rest of the atrium.
Continuous variables are presented as median (interquartile range) and categorical variables as number and frequency. Continuous variables were compared with the non-parametric Mann-Whitney or Kruskal-Wallis tests. Fisher's exact test was used to test for differences in frequencies of categorical variables. IBM SPSS version 20 for Mac OS X was used for the statistical analysis. A two-tailed p-value of <0.05 was taken to represent statistical significance.
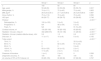
ResultsResults of the assessment and comparisons between the three groups are presented in Table 1.
Results of the assessment and comparisons between the three groups.
| Group 1 | Group 2 | Group 3 | p | |
|---|---|---|---|---|
| n | 150 | 60 | 60 | |
| Age, years | 59 (48-65) | 63 (53-69) | 65 (56-70) | 0.001* |
| Male gender, % | 74 (n=111) | 72 (n=43) | 73 (n=44) | 0.805 |
| BMI, kg/m2 | 26.6 (24.2-29.1) | 27.1 (24.0-28.6) | 26.3 (24.5-28.9) | 0.987 |
| Sinus rhythm, % | 75 (n=112) | 70 (n=42) | 70 (n=42) | 0.590 |
| HR, bpm | 68 (59-77) | 66 (58-75) | 65 (58-80) | 0.746 |
| Protocol | <0.001*,** | |||
| Retrospective, % | 100 (n=150) | 5 (n=3) | 3 (n=2) | |
| Prospective, % | NA | 98 (n=59) | 5 (n=3) | |
| Flash, % | NA | NA | 91.7(n=55) | |
| Contrast volume, ml | 100 (90-108) | 90 (80-100) | 65 (60-65) | <0.001*,** |
| Radiation 1st scan, mGy.cm | 402 (286-670) | 95 (72-146) | 41 (28-50) | <0.001*,** |
| Radiation 1st scan (median effective dose), mSv | 5.6 | 1.3 | 0.6 | <0.001*,** |
| 2nd scan, % | 11 (n=17) | 10 (n=6) | 5 (n=3) | 0.165 |
| Tube current | <0.001*,** | |||
| 70 kV, % | 0 | 0 | 33.3 (n=20) | |
| 80 kV, % | 0 | 82 (n=49) | 57 (n=34) | |
| 90 kV, % | 0 | 0 | 3 (n=2) | |
| 100 kV, % | 83 (n=125) | 20 (n=12) | 2 (n=1) | |
| 120 kV, % | 17 (n=25) | 2 (n=1) | 5 (n=3) | |
| Presence of thrombus | 1 (n=1) | 2 (n=1) | 0 | 0.556 |
| Diagnostic accuracy, % | 100 | 100 | 100 | 1.00 |
| LA volume at 70% of R-R interval, ml | 83 (65-105) | 80 (69-96) | 87 (66-99) | 0.767 |
BMI: body mass index; HR: heart rate; LA: left atrial.
Median effective radiation doses were 5.6 mSv (DLP 402×0.014) in Group 1 exams, 1.3 mSv (DLP 95×0.014) in Group 2 and 0.6 mSv (DLP 41×0.014) in Group 3.
There were marked differences between the protocols in terms of tube current used, which led to significant differences in radiation doses.
Contrast doseMore recent protocols also led to a significant reduction in contrast dose, from a mean of 100 ml in Group 1 to 65 ml in Group 3.
Subjective evaluation of image qualityAll the exams were considered diagnostic. There was a non-significant tendency for less frequent need for a second exam with later protocols, from 11% in Group 1 (of these 17 cases, in only one did a less dense area actually correspond to a thrombus, confirmed by transesophageal echocardiography [TEE]) (Figures 4-6) to only 5% in Group 3 (p=0.057).
Objective evaluation of image quality
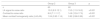
The objective evaluation of image quality (Table 2) showed that despite the lower radiation dose and contrast volume in Group 3 than in Group 2, exams in the former group showed significantly better signal-to-noise and contrast-to-noise ratios and density homogeneity ratio between the LA and the LAA.
Objective evaluation of image quality.
| Group 2 | Group 3 | p | |
|---|---|---|---|
| n | 60 | 60 | |
| LA signal-to-noise ratio | 10.0 (8.3-12.1) | 13.5 (11.0-16.2) | <0.001 |
| Contrast-to-noise ratio | 8.8 (7.1-11.7) | 14.8 (12.6-17.0) | <0.001 |
| Mean contrast homogeneity ratio (LA/LAA) | 1.04 (0.93-1.14) | 0.92 (0.86-0.99) | <0.001 |
Contrast-to-noise ratio: mean LAA CT density - mean left ventricular CT density)/standard deviation of LAA; LA: left atrium; LAA: left atrial appendage.
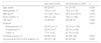
Table 3 shows that the need for a second scan did not correlate significantly with atrial volume (although there was a tendency for a second scan to be required in patients with larger atrial volume, p=0.087), but did correlate with the presence of AF and with mean heart rate during the scan.
Predictors of the need for a second scan.
| 2nd scan (n=26) | No 2nd scan (n=244) | p | |
|---|---|---|---|
| Age, years | 60 (53-67) | 61 (51-67) | 0.836 |
| Male gender, % | 73% (n=19) | 73% (n=178) | 1.000 |
| BMI, kg/m2 | 27.9 (24.1-30.1) | 26.5 (24.4-29.1) | 0.455 |
| Sinus rhythm, % | 50% (n=13) | 75% (n=183) | 0.011 |
| HR, bpm | 73 (65-89) | 66 (58-77) | 0.039 |
| Protocol | 0.381 | ||
| Retrospective, % | 65.4% (n=17) | 52.5% (n=128) | |
| Prospective, % | 26.9% (n=7) | 26.2% (n=64) | |
| Flash, % | 7.7% (n=2) | 21.3% (n=52) | |
| Contrast volume, ml | 95 (80-103) | 90 (65-102) | 0.397 |
| LA volume at 70% of R-R interval, ml | 93 (70-118) | 82 (67-99) | 0.087 |
BMI: body mass index; HR: heart rate; LA: left atrial.
Cardiac CT is currently considered to be the only imaging modality required prior to AF ablation, since it can provide excellent anatomical mapping and exclude intracardiac thrombus.9,15 However, its accuracy, and hence its value as a single pre-ablation exam, depends on the exclusion of false positives, by differentiating between true thrombi and pseudothrombi, which are not uncommon and may be due to inhomogeneous mixing of contrast and blood between the LA and the LAA.16
Of the various methods for distinguishing between true and false thrombi in the LAA, we decided to assess images immediately after reconstruction in all cases, and if the CT density ratio between the LA and the LAA did not allow thrombus to be excluded, the scan was repeated within 3 min, with no further contrast administration and limited to the LAA. In order to reduce the need for such a second scan (which was infrequent), the beginning of the initial scan was delayed to increase the bolus tracking trigger and the delay between the trigger and the beginning of the scan itself.
These changes to the scanning protocol resulted in a non-significant trend for a reduction in the need for a second scan, from 11% in Group 1 to 5% in Group 3 (p=0.057).
The need for a second scan was found to correlate with the presence of AF and with mean heart rate during the scan, but not with atrial volume (although there was a tendency for a second scan to be required in patients with larger atrial volume, p=0.087). These findings are in agreement with predictors of contrast filling defects in the LAA during cardiac CT identified by other authors. Singh et al.17 found that such filling defects were associated with left atrial dilatation, while in Madan et al.,18 they were related to permanent AF. In the latter study, AF during acquisition and age were independent predictors of filling defects after multivariate analysis.
The timing of acquisition in our protocol aimed not only to reduce the need for a second scan but also to optimize image quality through high signal-to-noise and contrast-to-noise ratios, without increasing contrast volume or radiation dose. This was achieved, with significantly lower contrast and radiation in Group 3 than in Group 1 (p<0.001). In previous publications, our group showed that AF during scanning was a predictor of higher radiation doses, which highlights the need to adopt scanning protocols that reduce doses in these patients, especially those who will require serial imaging exams using ionizing radiation throughout their lives.19,20
It should also be noted that the objective comparison between the two scanners used revealed improved image quality with the later model, despite lower radiation dose and contrast volume. Furthermore, all the exams were considered diagnostic for exclusion of thrombus in independent assessments by a radiologist and a cardiologist with wide experience in cardiac CT, even though 74 exams (17% of cases) were performed while the patient was in AF. Images with greater diagnostic accuracy can be obtained in patients with AF by reconstruction immediately after the T wave based on absolute time (in ms) rather than relative time (percentage of the R-R interval), which enables artefacts induced by the arrhythmia to be removed.
As stated above, there are other ways to optimize cardiac CT protocols. Lazoura et al.21 used a dual-phase protocol with delayed contrast enhancement to study 122 patients, of whom 16% had filling defects on the first pass, for all of which the second pass was diagnostic, as in our series. Three of these filling defects were confirmed as true thrombi. The fact that a second pass was only in fact necessary in 16% of cases (and only 5% in Group 3 in our study) suggests that our decision to perform a second scan only when necessary is the correct one. The radiation dose in Lazoura et al.’s population was higher than in ours.
Teunissen et al.22 used a double contrast injection followed by a single acquisition in a study of 605 patients. Mean contrast volume was 100 ml and mean radiation dose was 3.1 mSv. Filling defects necessitating a second scan were detected in 4.3% of cases. This protocol resulted in a similar rate of second scans as in our series, but entailed higher contrast and radiation doses.
A non-ECG-gated protocol was compared with ECG-gated protocols by Iwayama et al.23 in 60 patients before pulmonary vein isolation without assessing the presence of thrombus. The mean radiation in the non-gated group was 1.1 mSv. The fact that this CT protocol did not include exclusion of thrombus means that TEE was required, which is associated with greater cost and patient morbidity. Furthermore, even without ECG gating, the radiation dose was higher than in our series.
In another study using a non-ECG-gated protocol prior to AF ablation without assessing the presence of thrombus, Annoni et al.24 examined 200 patients, 100 of them in a low-dose group. As in the study by Iwayama et al.,23 TEE was required to exclude thrombus. It should be noted that radiation doses in this study were the lowest of those cited here, with a mean of 0.4 mSv, which is similar to those in our Group 3 (0.6 mSv) (Table 4).
Comparison with other studies.
| Marques et al. (Group 3 of the present study) | Lazoura et al.21 | Teunissen et al.22 | Iwayama et al.23 | Annoni et al.24 | |
|---|---|---|---|---|---|
| No. of patients in reference group (total in study) | 60 (270) | 122 (122) | 605 (605) | 20 (60) | 100 (200) |
| ECG gating | Yes | Yes | Yes | No | No |
| Double contrast injection | No | No | Yes | No | No |
| Intended to exclude thrombus | Yes | Yes | Yes | No | No |
| Exams in which thrombus could not be excluded, % | 0 | 0 | 0 | NA | NA |
| 2nd scan performed, % | 5 | 100 | 4.30 | NA | NA |
| Need for 2nd scan, % | 5 | 16 | 4.30 | NA | NA |
| TEE prior to AF ablation | Not required | Not required | Not required | Required | Required |
| Radiation dose, mSv | 0.6 | 3.5 | 3.1 | 1.1 | 0.4 |
| Contrast dose, ml | 64 | 90 | 100 | 28.7 | 80 |
AF: atrial fibrillation; ECG: electrocardiogram; TEE: transesophageal echocardiography.
The prevalence of thrombus identified prior to AF ablation varies considerably. In a meta-analysis comparing studies using cardiac CT and TEE, the prevalence ranged between 20.6% (13 thrombi in 63 patients) and 1.3% (three thrombi in 223 patients).25 In a more recent series, Teunissen et al.22 detected only two thrombi in 605 patients, a prevalence of 0.3%. The prevalence was also low in our study (around 1%), which may be because our population was relatively low risk, with regular medical follow-up and high rates of anticoagulation.
In view of the results presented, we consider that the most recent protocol described in this study (Group 3) for cardiac CT study as the only exam prior to AF ablation reduces radiation doses without sacrificing quality, as confirmed by the objective assessment of image quality.
LimitationsPossible limitations of the study include the fact that TEE was not performed in all patients, only to confirm the existence of thrombi detected by cardiac CT. However, the diagnostic accuracy of cardiac TC for identifying thrombus is very high, and when delayed imaging is performed, the false positive rate is very low.9 The iodine concentration in the contrast increased from Group 1 to Group 2 (from 320 to 370 mg I/ml), but the flow rate in Group 2 was reduced in compensation. The number of thrombi detected in our series was low, but this is a common finding in patients who undergo cardiac CT prior to AF ablation; possible contributing factors could be that these were elective patients with regular medical follow-up and high rates of anticoagulation. An objective evaluation of image quality was only performed for Groups 2 and 3, since this took place when the new technology was introduced; there was, however, subjective image quality assessment in all groups. We did not test a non-ECG-gated protocol, which may enable lower radiation doses.24 However, in Flash mode, such reductions are unlikely to be significant, while the diagnostic accuracy of non-gated CT for exclusion of cardiac thrombus has not been established, which limits its adoption as a single exam prior to AF ablation.
ConclusionsProtocol optimization and technological advances both contributed to significantly lower radiation dose (to sub-mSv levels) and contrast volume used in cardiac CTs prior to AF ablation, without compromising image quality.
Conflicts of interestThe authors have no conflicts of interest to declare.
Please cite this article as: Marques H, de Araújo Gonçalves P, Ferreira AM, et al. Tomografia computorizada cardíaca prévia a ablação de fibrilhação auricular – efeitos da evolução tecnológica e otimização de protocolos. Rev Port Cardiol. 2018;37:873–883.
