


Several scoring systems have been developed for risk stratification in patients with acute pulmonary embolism (PE). The Pulmonary Embolism Severity Index (PESI) and its simplified version (sPESI) are among the most used, however the high number of variables hinder its application. Our aim was to derive an easy-to-perform score based on simple parameters obtained at admission to predict 30-day mortality in acute PE patients.
MethodsRetrospective study in 1115 patients with acute PE from two institutions (derivation cohort n=835, validation cohort n=280). The primary endpoint was all-cause mortality at 30 days. Statistically and clinically relevant variables were selected for multivariable Cox regression analysis. We derived and validated a multivariable risk score model and compared to other established scores.
ResultsThe primary endpoint occurred in 207 patients (18.6%). Our model included five variables weighted as follows: modified shock index ≥1.1 (hazard ratio [HR] 2.57, 1.68–3.92, p<0.001), active cancer (HR 2.27, 1.45–3.56, p<0.001), altered mental state (HR 3.82, 2.50–5.83, p<0.001), serum lactate concentration ≥2.50 mmol/L (HR 5.01, 3.25–7.72, p<0.001), and age ≥80 years (HR 1.95, 1.26–3.03, p=0.003). The prognostic ability was superior to other scores (area under curve [AUC] 0.83 [0.79–0.87] vs 0.72 [0.67–0.79] in PESI and 0.70 [0.62–0.75] in sPESI, p<0.001) and its performance in the validation cohort was deemed good (73 events in 280 patients, 26.1%, AUC=0.76, 0.71–0.82, p<0.0001) and superior to other scores (p<0.05).
ConclusionsThe PoPE score (https://tinyurl.com/ybsnka8s) is an easy tool with superior performance to predict early mortality in patients admitted for PE with non-high-risk PE.
Existem vários sistemas de pontuação para a estratificação de risco de doentes com embolia pulmonar (EP). O Pulmonary Embolism Severity Index (PESI) e a versão simplificada (sPESI) são os mais usados, mas o elevado número de variáveis prejudica a sua utilização. Pretendemos derivar um score fácil de aplicar para prever a mortalidade precoce em doentes com EP.
MétodosEstudo retrospetivo em 1115 doentes com EP aguda de duas instituições (cohort de derivação n=835, cohort de validação n=280). O endpoint primário foi mortalidade por todas as causas aos 30 dias. Variáveis clínica e estatisticamente relevantes foram selecionadas para análise por regressão multivariada. Derivámos e validámos um score de risco multivariável e comparámos com scores estabelecidos.
ResultadosO endpoint primário ocorreu em 207 doentes (18,6%). O score modelo incluiu cinco variáveis com as seguintes caraterísticas: índice de choque modificado >1,1 (HR 2,57, 1,68-3,92, p<0,001), neoplasia ativa (HR 2,27, 1,45-3,56, p<0,001), alteração do estado de consciência (HR 3,82, 2,50-5,83, p<0,001), concentração de lactato sérica ≥2,50 mmol/L (HR 5,01, 3,25-7,72, p<0,001) e idade ≥80 anos (HR 1,95, 1,26-3,03, p=0,003). O desempenho prognóstico foi superior a outros scores (AUC 0,83 [0,79-0,87] versus 0,72 [0,67-0,79] no PESI e (0,70 [0,62-0,75]) no sPESI, p<0,001) e a sua performance na cohort de validação foi boa (73 eventos em 280 doentes, 26,1%, AUC 0,76, 0,71-0,82, p<0,0001) e superior aos outros scores (p<0,05).
ConclusõesO score PoPE (https://tinyurl.com/ybsnka8s) é um instrumento fácil com performance superior para prever mortalidade precoce em doentes admitidos com EP de baixo risco.
Acute pulmonary embolism (PE) is characterized by clinical manifestations that range from a completely asymptomatic patient to cardiopulmonary arrest.1 Mortality rates vary among published studies and are mostly dependent on patient characteristics and clinical presentation.2–4 Different prognostic models have been developed to aid clinical decision making and risk stratification of acute PE patients. Of these, the Pulmonary Embolism Severity Index (PESI) score has revealed the highest accuracy and currently is the most used in clinical practice, as recommended by international guidelines.5 However, the high number of parameters needed to estimate this score makes it difficult to use in everyday practice. Furthermore, some of the required variables (e.g., history of heart failure, history of chronic lung disease) are ambiguous and dependent on individual interpretation. Since mortality rates in acute PE are mainly dependent on the severity of cardiopulmonary dysfunction at presentation and accompanying comorbidities,6–8 simplified models have been developed (e.g. sPESI), with facilitated assessment and superior performance.6
ObjectivesOur main goal was to provide a sensible, pragmatic, and easy to use score dependent exclusively on parameters that are obtained upon first clinical encounter, and to evaluate its performance in predicting 30-day (early) all-cause mortality.
MethodsStudy design and participantsWe conducted a retrospective study of consecutive patients with confirmed acute PE who were admitted in two medical centers (Prof. Doutor Fernando Fonseca Hospital, Amadora, and Santa Maria Hospital, Lisbon, Portugal). PE patients were identified by the International Statistical Classification of Diseases and Related Health Problems 9th Revision. The derivation cohort comprised patients from Prof. Doutor Fernando Fonseca Hospital (between January 2013 and December 2018) while the external validation cohort consisted of patients from Santa Maria Hospital (from January 2013 to November 2018). For the external validation cohort, we aimed for at least 30% of the derivation cohort.
Patients were eligible if they met all the following criteria: (1) had an acute PE confirmed by computed tomography pulmonary angiography (CTPA); (2) PE diagnosis was made within the first 24 h after first medical contact; (3) an admission arterial blood gas (ABG) test with lactate concentration measurement was performed and recorded; (4) patients were ≥18 years old and (5) 30-day follow-up information was available. Exclusion criteria included: (1) cardiorespiratory arrest or impending hemodynamic collapse at presentation; (2) subsegmental PE on CTPA (given the lower probability of events)9 and (3) attending physician's decision to perform fibrinolysis despite hemodynamic stability. The study protocol conforms to the ethical guidelines of the 1975 Declaration of Helsinki as reflected in a priori approval by the local institution's human research committee.
Data collectionAcute PE was diagnosed according to the 2014 European Society of Cardiology guidelines.10 Electronic medical records (during admission and after discharge) were reviewed. These included: (1) demographic and clinical variables (age, cardiac arrest at presentation, history of cardiac, pulmonary disease and history of active cancer); (2) physical examination (heart rate, blood pressure, [systolic, diastolic and mean], modified shock index [heart rate to mean blood pressure ratio], altered mental state [defined by a Glasgow Coma Scale <15], respiratory rate and peripheral oxygen saturation); (3) laboratory tests (ABG parameters with lactate concentration, high sensitivity troponin T [Elecsys Troponin T Stat Roche®], NT-proBNP [Elecsys proBNP II Stat Roche®], estimated glomerular filtration rate, serum hemoglobin) and (4) echocardiography parameters (right ventricular dysfunction [tricuspid annular plane systolic excursion, McConnel sign, septal “D-shape”, 60/60 sign],10,11 left ventricular ejection fraction using biplanar Simpson's method). Risk scores were calculated for each patient at admission and included the Pulmonary Embolism Severity Index (PESI) and its simplified version (sPESI).12,13
EndpointsThe primary endpoint was defined as 30-day all-cause mortality after initial assessment in the Emergency Department (ED). Follow-up was performed by careful review of patients’ medical records and national health data registry. Secondary endpoints included: all-cause mortality at 7 days, rescue fibrinolysis, and a composite of both.
Score development and statistical analysisUnivariable Cox regression analysis was applied to relate a broad range of admission parameters to the study endpoints. Variables with a bilateral p-value <0.05 or deemed clinically relevant by the investigators were selected for multivariable Cox regression analysis using an ‘enter’ method. A score-based prediction rule for the primary endpoint was developed from the model using a regression coefficient-based scoring method. Integer scores were assigned by dividing risk-factor hazard ratio by the lowest coefficient and rounding up to the nearest unit for categorical variables. The discriminative ability of our model was assessed using receiver operating characteristic curve analysis and its calibration was evaluated with the modified Hosmer–Lemeshow Chi-squared statistic, where values <20 were set for good calibration.
Continuous variables with normal distribution were expressed as mean and standard deviation (SD), otherwise as median and interquartile range (IQR). Normality was tested with the Kolmogorov–Smirnov test and Q–Q Plot visual assessment. Discrete variables were expressed as absolute frequencies with percentages. Comparisons between groups were performed using Students’ t-test or Mann–Whitney U test as appropriate. Categorical variables were compared using Fisher's exact test. All statistical analyses were performed using commercially available software (SPSS 23.0, IBM). Statistical significance was defined as a bilateral p-value <0.05.
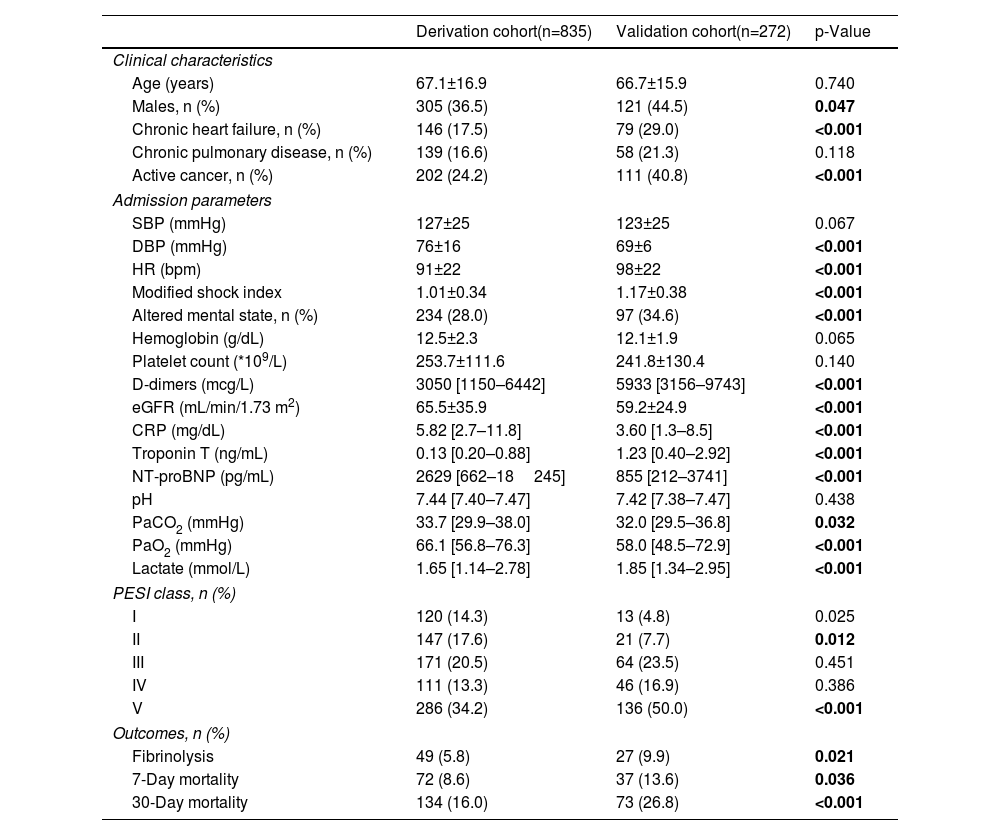
ResultsBaseline characteristicsThe patient flow chart is depicted in Figure 1. The final study sample comprised 1115 patients, 835 in the derivation cohort and 280 in the validation cohort. Baseline characteristics of both cohorts and corresponding endpoints are summarized in Table 1. The primary outcome occurred in 134 (16.0%) patients in the derivation cohort and in 73 (26.8%) patients in the validation cohort (p<0.0001). The median time to death was 8 [IQR 2–15] days in the derivation cohort and 7 [IQR 4–11] days in the validation cohort (p=0.211). Importantly, significant differences were found between the two groups (Table 1). The validation cohort comprised higher risk patients: patients were older, had a higher prevalence of chronic heart failure and active cancer and poorer hemodynamic profiles at admission.

Baseline characteristics in the derivation and validation cohorts.
| Derivation cohort(n=835) | Validation cohort(n=272) | p-Value | |
|---|---|---|---|
| Clinical characteristics | |||
| Age (years) | 67.1±16.9 | 66.7±15.9 | 0.740 |
| Males, n (%) | 305 (36.5) | 121 (44.5) | 0.047 |
| Chronic heart failure, n (%) | 146 (17.5) | 79 (29.0) | <0.001 |
| Chronic pulmonary disease, n (%) | 139 (16.6) | 58 (21.3) | 0.118 |
| Active cancer, n (%) | 202 (24.2) | 111 (40.8) | <0.001 |
| Admission parameters | |||
| SBP (mmHg) | 127±25 | 123±25 | 0.067 |
| DBP (mmHg) | 76±16 | 69±6 | <0.001 |
| HR (bpm) | 91±22 | 98±22 | <0.001 |
| Modified shock index | 1.01±0.34 | 1.17±0.38 | <0.001 |
| Altered mental state, n (%) | 234 (28.0) | 97 (34.6) | <0.001 |
| Hemoglobin (g/dL) | 12.5±2.3 | 12.1±1.9 | 0.065 |
| Platelet count (*109/L) | 253.7±111.6 | 241.8±130.4 | 0.140 |
| D-dimers (mcg/L) | 3050 [1150–6442] | 5933 [3156–9743] | <0.001 |
| eGFR (mL/min/1.73 m2) | 65.5±35.9 | 59.2±24.9 | <0.001 |
| CRP (mg/dL) | 5.82 [2.7–11.8] | 3.60 [1.3–8.5] | <0.001 |
| Troponin T (ng/mL) | 0.13 [0.20–0.88] | 1.23 [0.40–2.92] | <0.001 |
| NT-proBNP (pg/mL) | 2629 [662–18245] | 855 [212–3741] | <0.001 |
| pH | 7.44 [7.40–7.47] | 7.42 [7.38–7.47] | 0.438 |
| PaCO2 (mmHg) | 33.7 [29.9–38.0] | 32.0 [29.5–36.8] | 0.032 |
| PaO2 (mmHg) | 66.1 [56.8–76.3] | 58.0 [48.5–72.9] | <0.001 |
| Lactate (mmol/L) | 1.65 [1.14–2.78] | 1.85 [1.34–2.95] | <0.001 |
| PESI class, n (%) | |||
| I | 120 (14.3) | 13 (4.8) | 0.025 |
| II | 147 (17.6) | 21 (7.7) | 0.012 |
| III | 171 (20.5) | 64 (23.5) | 0.451 |
| IV | 111 (13.3) | 46 (16.9) | 0.386 |
| V | 286 (34.2) | 136 (50.0) | <0.001 |
| Outcomes, n (%) | |||
| Fibrinolysis | 49 (5.8) | 27 (9.9) | 0.021 |
| 7-Day mortality | 72 (8.6) | 37 (13.6) | 0.036 |
| 30-Day mortality | 134 (16.0) | 73 (26.8) | <0.001 |
BNP: brain natriuretic peptide; CRP: C-reactive protein; DPB: diastolic blood pressure; eGFR: estimated glomerular filtration rate; H: heart rate; PESI: Pulmonary Embolism Severity Index; SBP: systolic blood pressure.
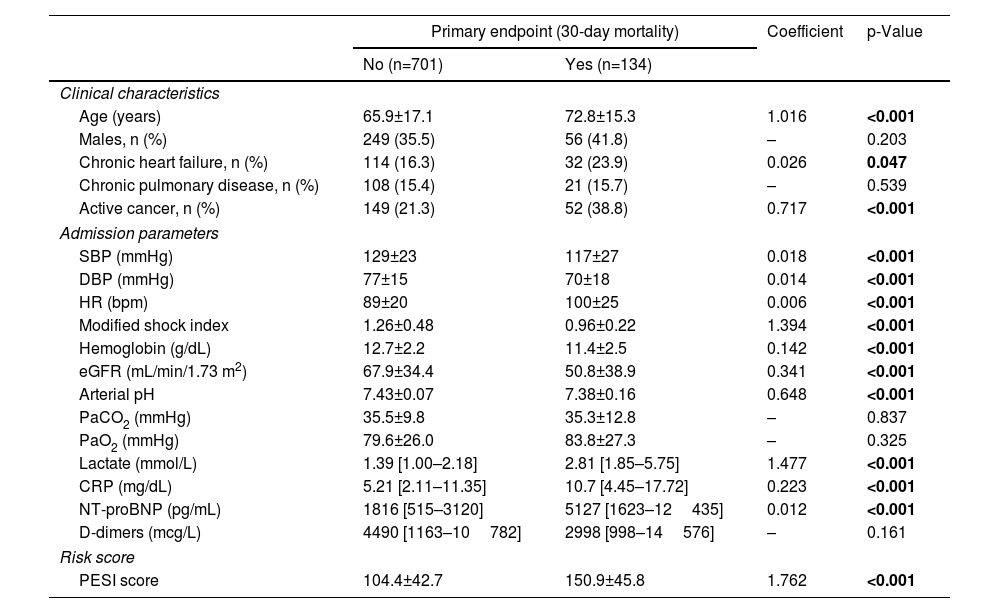
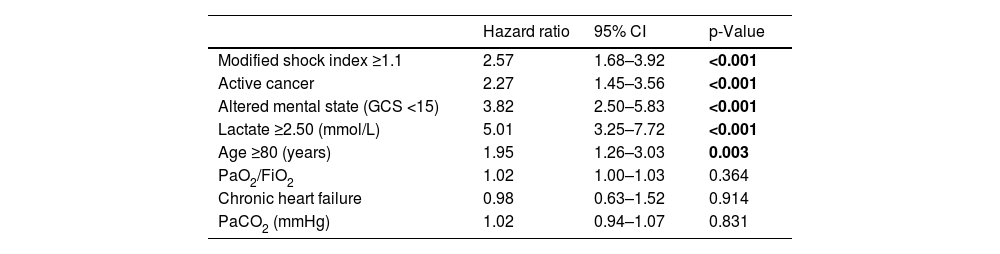
Results of univariable analysis for all potential outcome predictors are described in Table 2. Stratified analysis was based on the cut-off value for the last quartile of modified shock index (1.1), serum lactate concentration (2.50 mmol/L) and age (80 years). The multivariable model for 30-day all-cause mortality is detailed in Table 3. From the admission parameters, modified shock index ≥1.1 (HR 2.57, 95% confidence interval [CI] 1.68–3.92, p<0.001), active cancer (HR 2.27, 95% CI 1.45–3.56, p<0.001), altered mental state (HR 3.82, 95% CI 2.50–5.83, p<0.001), lactate concentration ≥2.50 mmol/L (HR 5.01, 95% CI 3.25–7.72, p<0.001) and age ≥80 years (HR 1.95, 95% CI 1.26–3.03, p=0.003) were all independent predictors of death at 30 days.
Univariable analysis (derivation cohort).
| Primary endpoint (30-day mortality) | Coefficient | p-Value | ||
|---|---|---|---|---|
| No (n=701) | Yes (n=134) | |||
| Clinical characteristics | ||||
| Age (years) | 65.9±17.1 | 72.8±15.3 | 1.016 | <0.001 |
| Males, n (%) | 249 (35.5) | 56 (41.8) | – | 0.203 |
| Chronic heart failure, n (%) | 114 (16.3) | 32 (23.9) | 0.026 | 0.047 |
| Chronic pulmonary disease, n (%) | 108 (15.4) | 21 (15.7) | – | 0.539 |
| Active cancer, n (%) | 149 (21.3) | 52 (38.8) | 0.717 | <0.001 |
| Admission parameters | ||||
| SBP (mmHg) | 129±23 | 117±27 | 0.018 | <0.001 |
| DBP (mmHg) | 77±15 | 70±18 | 0.014 | <0.001 |
| HR (bpm) | 89±20 | 100±25 | 0.006 | <0.001 |
| Modified shock index | 1.26±0.48 | 0.96±0.22 | 1.394 | <0.001 |
| Hemoglobin (g/dL) | 12.7±2.2 | 11.4±2.5 | 0.142 | <0.001 |
| eGFR (mL/min/1.73 m2) | 67.9±34.4 | 50.8±38.9 | 0.341 | <0.001 |
| Arterial pH | 7.43±0.07 | 7.38±0.16 | 0.648 | <0.001 |
| PaCO2 (mmHg) | 35.5±9.8 | 35.3±12.8 | – | 0.837 |
| PaO2 (mmHg) | 79.6±26.0 | 83.8±27.3 | – | 0.325 |
| Lactate (mmol/L) | 1.39 [1.00–2.18] | 2.81 [1.85–5.75] | 1.477 | <0.001 |
| CRP (mg/dL) | 5.21 [2.11–11.35] | 10.7 [4.45–17.72] | 0.223 | <0.001 |
| NT-proBNP (pg/mL) | 1816 [515–3120] | 5127 [1623–12435] | 0.012 | <0.001 |
| D-dimers (mcg/L) | 4490 [1163–10782] | 2998 [998–14576] | – | 0.161 |
| Risk score | ||||
| PESI score | 104.4±42.7 | 150.9±45.8 | 1.762 | <0.001 |
BNP: brain natriuretic peptide; CRP: C-reactive protein; DPB: diastolic blood pressure; eGFR: estimated glomerular filtration rate; HR: heart rate; PESI: Pulmonary Embolism Severity Index; SBP: systolic blood pressure.
Bold values are statistically significant.
Multivariable analysis (Cox regression).
| Hazard ratio | 95% CI | p-Value | |
|---|---|---|---|
| Modified shock index ≥1.1 | 2.57 | 1.68–3.92 | <0.001 |
| Active cancer | 2.27 | 1.45–3.56 | <0.001 |
| Altered mental state (GCS <15) | 3.82 | 2.50–5.83 | <0.001 |
| Lactate ≥2.50 (mmol/L) | 5.01 | 3.25–7.72 | <0.001 |
| Age ≥80 (years) | 1.95 | 1.26–3.03 | 0.003 |
| PaO2/FiO2 | 1.02 | 1.00–1.03 | 0.364 |
| Chronic heart failure | 0.98 | 0.63–1.52 | 0.914 |
| PaCO2 (mmHg) | 1.02 | 0.94–1.07 | 0.831 |
CI: confidence interval; FiO2: fraction of inspired oxygen; GCS: Glasgow Coma Scale.
Bold values are statistically significant.
Based on the HR for each variable, we attributed one point to each condition, with the exception of lactate concentration ≥2.50 mmol/L which was given two points, with a total score ranging from 0 to 6. The new model for early 30-day mortality prediction in patients with acute PE was given the acronym PoPE (PrOgnosis in Pulmonary Embolism). The PoPE score yielded good prognostic performance in predicting in-hospital death (AUC 0.83, 95% CI 0.79–0.87, p<0.0001). The Kaplan–Meier analysis showed a statistically significant survival difference between groups according to the cut-off point (Figure 2).

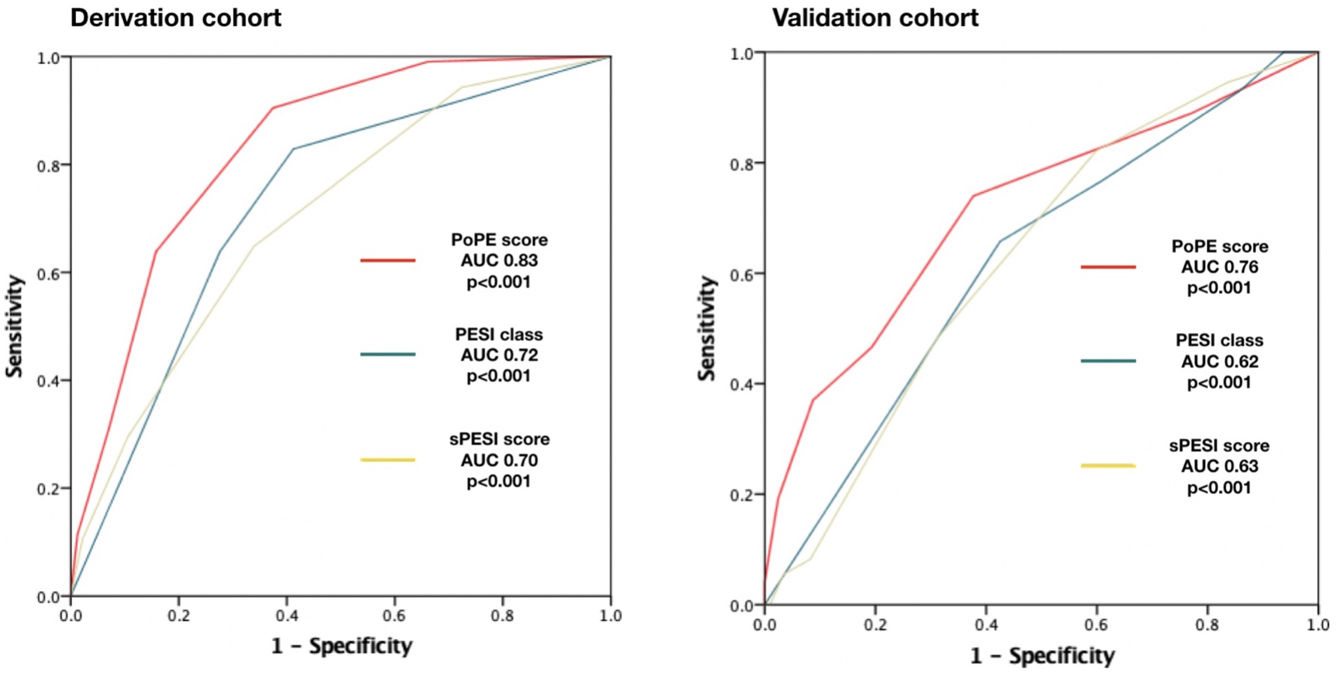
PoPE score performance was superior to PESI (AUC 0.83, 95% CI 0.79–0.87 vs 0.72, 95% CI 0.67–0.79, p<0.001) and sPESI scores (AUC 0.83, 0.79–0.87 vs 0.70, 0.62–0.75, p<0.001) – Figure 3A. A PoPE score ≥2 showed a sensibility of 90.3% and a specificity of 63.4% in predicting all-cause 30-day mortality (Table 4). The final model was well calibrated (Hosmer–Lemeshow Chi-squared 5.08, p=0.279).
.")
Performance of the different scores to predict 30-day all-cause mortality.
| PoPE | PESI | sPESI | |
|---|---|---|---|
| Cut-off | 2 | III | I |
| Sensibility (95% CI) | 90.3 (84.0–94.7) | 91.0 (84.9–95.3) | 73.9 (65.6–81.2) |
| Specificity (95% CI) | 63.4 (59.8–67.1) | 36.4 (32.8–40.1) | 42.4 (38.7–46.1) |
| PPV (95% CI) | 32.1 (29.7–34.6) | 21.5 (20.2–22.8) | 19.7 (17.9–21.6) |
| NPV (95% CI) | 97.2 (95.3–98.3) | 95.5 (92.5–97.4) | 89.5 (86.3–91.9) |
NPV: negative predictive value; PPV: positive predictive value.
There were 73 primary outcome events in the validation cohort (26.8%). The AUC for the PoPE score was 0.76, 95% CI 0.71–0.82, p<0.0001 and its performance was still superior when compared with PESI (AUC 0.76 vs 0.62, p<0.001) and sPESI scores (AUC 0.76 vs 0.63, p<0.001) – Figure 3B. A total PoPE score ≥1 showed a sensibility of 87% and a specificity of 66% in predicting all-cause 30-day mortality.
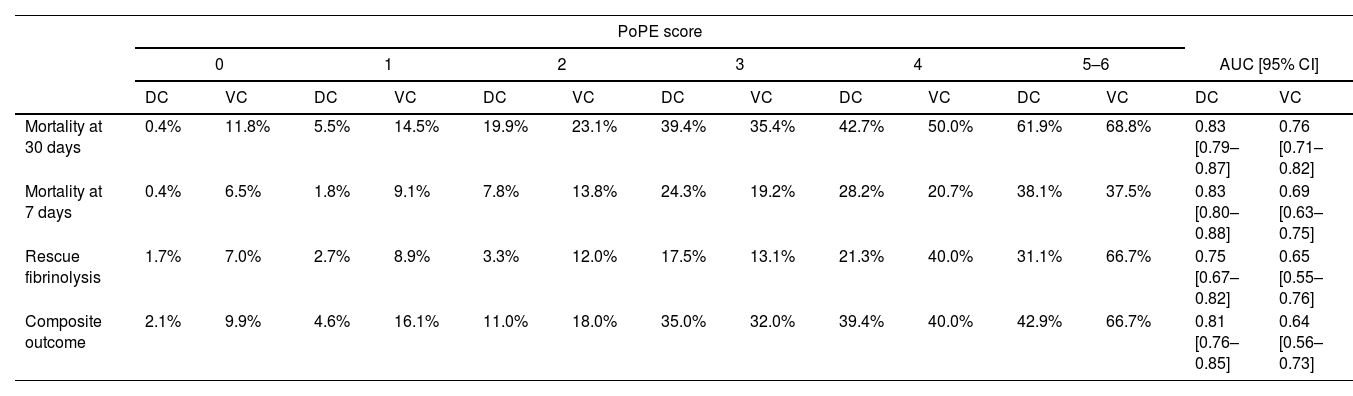
Table 5 summarizes the incidence of the study's primary and secondary endpoints across PoPE scores and corresponding AUCs. The calibration plots in both cohorts comparing predicted risk to observed events by PoPE score values are illustrated in Figure 4.
Rate of events according to PoPE score for derivation and validation cohorts.
| PoPE score | ||||||||||||||
|---|---|---|---|---|---|---|---|---|---|---|---|---|---|---|
| 0 | 1 | 2 | 3 | 4 | 5–6 | AUC [95% CI] | ||||||||
| DC | VC | DC | VC | DC | VC | DC | VC | DC | VC | DC | VC | DC | VC | |
| Mortality at 30 days | 0.4% | 11.8% | 5.5% | 14.5% | 19.9% | 23.1% | 39.4% | 35.4% | 42.7% | 50.0% | 61.9% | 68.8% | 0.83 [0.79–0.87] | 0.76 [0.71–0.82] |
| Mortality at 7 days | 0.4% | 6.5% | 1.8% | 9.1% | 7.8% | 13.8% | 24.3% | 19.2% | 28.2% | 20.7% | 38.1% | 37.5% | 0.83 [0.80–0.88] | 0.69 [0.63–0.75] |
| Rescue fibrinolysis | 1.7% | 7.0% | 2.7% | 8.9% | 3.3% | 12.0% | 17.5% | 13.1% | 21.3% | 40.0% | 31.1% | 66.7% | 0.75 [0.67–0.82] | 0.65 [0.55–0.76] |
| Composite outcome | 2.1% | 9.9% | 4.6% | 16.1% | 11.0% | 18.0% | 35.0% | 32.0% | 39.4% | 40.0% | 42.9% | 66.7% | 0.81 [0.76–0.85] | 0.64 [0.56–0.73] |
Composite outcome includes rescue fibrinolysis and mortality at 7 days.
DC: derivation cohort; VC: validation cohort.

We propose a new risk stratification tool for acute PE patients – the PoPE score. This is based on easily obtainable admission variables upon presentation to the ED: altered mental state, modified shock index, serum lactate, age and cancer. The PoPE score has good discrimination and calibration to predict early mortality in acute PE patients in both derivation and validation cohorts, exceeding in performance of other widely used scores such as PESI and sPESI. This score might prove to be a useful tool for selecting patients in need of closer monitoring or of a more aggressive treatment strategy. To facilitate implementation in clinical practice, we developed an online tool that can be accessed at https://tinyurl.com/ybsnka8s.
The PoPE scoreThe fundamental advantage of using a risk score such as PESI in patients with acute PE is that it allows the identification of a low-risk group (class I and II) who may be discharged early.14,15 Our model showed that prognosis was good in patients who scored 0 out of 6 in our model, with an early mortality rate of <0.5%. Two significantly different cohorts from two institutions were used here and performance was good in both.
Given the high number of variables that compose the original PESI score, an attempt was made to develop a simplified version – sPESI, which only includes 6 variables, and reportedly has similar prognostic accuracy.16 Subsequent reports showed that the prognostic accuracy of the original version was higher.17 We present an even simpler score that is superior to those already established in two different populations, however further validation is required.
Current recommendations advocate the use of imaging and laboratory parameters for assessment of right ventricular dysfunction in patients with acute PE for risk stratification, particularly in those with PESI III-IV-V.10 However, risk stratification at admission according to these recommendations is challenging and time consuming, particularly in normotensive patients who might have subclinical organ dysfunction albeit a normal hemodynamic profile and thus are at risk of being incorrectly stratified as low risk.
Furthermore, even normotensive patients can have a complicated course if the mechanisms of right ventricular ischemia are not corrected due to burnout of the compensatory mechanisms. This can occur in up to 10% of patients.18,19 The signs of impending systemic collapse that precede hemodynamic instability have already been proposed for prognostic assessment by other authors.20–22 However, these rely on laboratory and/or imaging parameters that substantially increase the time to stratification. Our model depends exclusively on admission variables with validated prognostic value that are easily obtained.
LimitationsThis is a retrospective study and patients were identified using the ICD-9 codification with the accompanying risk of selection bias due to coding procedures. We tried to minimize this bias by having confirmation of PE by CTPA mandatory for inclusion, unlike most reports validating PESI in the literature that rely on hospital database coding without any further confirmation.23,24 The primary endpoint included all-cause 30-day mortality, which does not necessarily reflect PE-related mortality. However, this was the primary outcome used in most studies that validated PESI.25 This study had a relatively long recruitment period, during which there was an update in the European PE recommendations.10 However, since recommended strategies for high-risk and non-high-risk PE remained similar, it is unlikely that our results were affected. Finally, the baseline characteristics and event rates from our population were different from the ones published in similar studies. Specifically, the high cancer prevalence and the exclusion of subsegmental PE are two major factors that might explain the high 30-day mortality rates in both cohorts, and possibly the poorer performance of sPESI compared to PoPE.
ConclusionsIn conclusion, our model showed good performance in predicting 30-day all-cause mortality in patients admitted for PE. This score might prove to be a useful tool for selecting patients in need of closer monitoring or a more aggressive treatment strategy.
Conflicts of interestThe authors have no conflicts of interest to declare.
