Contrast-enhanced multidetector computed tomography (MDCT) is useful for the diagnosis of pulmonary embolism (PE). However, current guidelines do not support its use for risk assessment in acute PE patients.
ObjectivesWe compared the prognostic impact of MDCT-derived indices regarding medium-term mortality in a population of intermediate- to high-risk PE patients, mostly treated by thrombolysis.
MethodsThirty-nine consecutive patients admitted to an intensive care unit with acute PE were studied. All patients had a pulmonary MDCT on admission to the emergency room as part of the diagnostic algorithm. We assessed the following MDCT variables: right ventricular/left ventricular diameter (RV/LV) ratio, arterial obstruction index, pulmonary artery-to-aorta diameter ratio and azygos vein diameter. A 33-month follow-up was performed.
ResultsMean age was 59.1±19.6 years, with 80% of patients receiving thrombolysis. Follow-up all-cause mortality was 12.8%. Of the MDCT-derived variables, only the RV/LV ratio had significant predictive value, being higher in patients who suffered the endpoint (1.6±0.5 vs. 1.9±0.4, p=0.046). Patients with an RV/LV ratio ≥1.8 had 11-fold higher medium-term all-cause mortality (3.8% vs. 38.8%, p<0.001). Regarding this endpoint, the c-statistic was 0.78 (95% CI, 0.60–0.96) for RV/LV ratio and calibration was good (goodness-of-fit p=0.594). No other radiological index was predictive of mortality.
ConclusionsMDCT gives the possibility, in a single imaging procedure, of diagnosing and assessing the prognosis of patients with intermediate- to high-risk PE. Although further studies are needed, the simple-to-calculate RV/LV ratio has good discrimination and calibration for predicting poorer outcomes in patients with acute PE.
A angiografia pulmonar por tomografia computadorizada com contraste (angio-TC) é recomendada para o diagnóstico mas não para a estratificação de risco em doentes com tromboembolia pulmonar (TEP).
ObjectivosDeterminar o impacto prognóstico a médio-prazo de vários índices radiológicos obtidos na angio-TC em doentes com TEP de médio a alto risco, a maioria tratados com fibrinólise.
MétodosEstudaram-se 39 doentes admitidos numa unidade de cuidados intensivos por TEP, todos com angio-TC prévia realizada na urgência e seguiram-se durante 33 meses. Mediram-se as seguintes variáveis: razão entre os diâmetros do ventrículo direito e ventrículo esquerdo (índice VD/VE), índice de obstrução arterial, razão ente os diâmetros da artéria pulmonar e aorta e diâmetro da veia ázigos.
ResultadosA idade média foi de 59,1 ± 19,6 anos; 80% dos doentes foram tratados com fibrinólise. Durante o período de seguimento clínico, a mortalidade foi 12,8%. Das variáveis analisadas, apenas o índice VD/VE demonstrou valor preditivo, sendo significativamente mais elevado nos doentes que faleceram (1,6 ± 0,5 versus 1,9 ± 0,4, p=0,046). Os doentes com um índice VD/VE ≥ 1,8 tiveram uma incidência 11 vezes superior de mortalidade a médio prazo (3,8% versus 38,8%, p < 0,001). Relativamente a este endpoint, o c-statistic foi de 0,78 (95% IC 0,60–0,96) e a calibração elevada (goodness-of-fit p=0,594). Nenhum outro índice radiológico demonstrou associação com a mortalidade.
ConclusõesA angio-TC permite num único exame, em doentes de médio e alto risco, diagnosticar e estratificar o risco da TEP. Apesar de serem necessários mais estudos, o índice VD/VE pode identificar doentes com pior prognóstico após uma TEP.
Pulmonary embolism (PE) ranges from asymptomatic forms to life-threatening massive arterial pulmonary bed obstruction and may be responsible for up to 15% of all in-hospital deaths.1 Mortality is thought to be caused in part by right ventricular (RV) pressure overload resulting in RV dilatation and dysfunction (RVD), ischemia with ensuing failure and ultimately death.2
PE can be difficult to diagnose and risk stratification is paramount, in order to choose the best therapeutic option for each patient.3,4 Contrast-enhanced multidetector computed tomography (MDCT) is currently the gold standard for diagnosing PE and has a growing role in risk stratification. Recent evidence has confirmed the good correlation between echocardiography and MDCT-derived indices of RVD and the ratio of right ventricular to left ventricular (RV/LV) short-axis diameters has emerged as the most accurate sign of RVD.5,6 Also, the extent of PE (the thrombus burden in the pulmonary bed) has been proposed as an important parameter for predicting RVD and death.7–9 At the same time, the number of patients with low-risk PE is increasing, due to the lower threshold of clinical suspicion and greater availability of diagnostic techniques.10
However, the majority of studies assessing RV/LV ratios exclude the most severe patients from MDCT analysis, particularly hemodynamically unstable patients. This is reflected by the low mean RV/LV ratios reported in the literature, ranging from 1.15,11 to 1.32.12,13 Moreover, the proportion of patients undergoing thrombolytic therapy in these studies was also low.
Our aim was to compare the prognostic impact of various MDCT-derived RVD indices on medium-term mortality in a population of intermediate- to high-risk PE patients, most of them treated by thrombolysis.
MethodsPatient populationWe retrospectively studied all patients with intermediate- to high-risk PE admitted to the intensive care unit of our department between November 2005 and July 2008. The diagnosis of PE was confirmed by 4- or 64-detector MDCT in all patients. The clinical severity of pulmonary embolism was stratified using the system proposed by the ESC guidelines.3 All patients had intermediate- (positive troponin I and/or RV dilatation/dysfunction on echocardiogram) or high-risk PE (shock, defined by systolic blood pressure <90 mmHg). Medical records of patients who were eligible for the study were reviewed by two of the authors, who were not involved in MDCT reporting. Clinical data was collected prospectively, including demographic, clinical, laboratory and echocardiographic data. We assessed a medium-term endpoint of all-cause mortality, and in-hospital clinical deterioration – a composite of in-hospital death, need for mechanical ventilation, inotrope usage and rethrombolysis – was also assessed. The protocol was reviewed by the institutional board. The population was divided into two groups, classified by survival status at follow-up (alive or deceased).
Therapeutic protocolDecisions on treatment were the responsibility of the attending physician. The indications for thrombolytic therapy were hypotension, severe hypoxemia, evidence of RV dysfunction on transthoracic echocardiography and evidence of severe pulmonary thrombus burden. Thirty-three (84.6%) patients underwent thrombolysis with alteplase (Actilyse®, Boehringer Ingelheim Pharma, Germany) followed by a continuous intravenous infusion of heparin. No patient underwent surgical or catheter-based embolectomy. Mean follow-up was three years and survival status was available for 97.4% of patients.
Transthoracic echocardiographyBedside standard two-dimensional echocardiography was performed by the on-call cardiologist with a portable Aloka® echocardiograph and was available in 30 patients (77%). Pulmonary artery systolic pressure (PASP) was derived from the right atrioventricular pressure gradient using peak velocity of tricuspid regurgitation with continuous wave Doppler in apical four-chamber view and the modified Bernoulli equation. Right atrial pressure was considered equal to 5 mmHg or 10 mmHg according to whether or not the inferior vena cava collapsed during inspiration, respectively.
Contrast-enhanced multidetector computed tomographyAll MDCT examinations were performed during patient stay in the emergency department by the on-call radiologist. Images were obtained on either a 4-slice or a 64-slice multidetector CT scanner during inspiratory breath holding when possible or during quiet breathing if the patient was short of breath. For patients on mechanical ventilation, ventilation was manually suspended in deep inspiration. Intravenous injection of contrast medium (80 ml of iodinated contrast material with a concentration of 400 mg/ml, at a rate of 3.5–5 ml/s) was started using a bolus tracking device, when attenuation of blood in the main pulmonary artery reached 100 Hounsfield units (HU) for the 4-slice MDCT and 180 HU for the 64-slice MDCT scanners, respectively.
Caudocranial helical acquisition was obtained with a collimation of 0.625–1.25 mm and a pitch of 0.9–1.5. Acquisition time was 0.5 s per rotation and tube current was modulated between 100 and 700 mA and 100 and 140 kV. The z-axis coverage started 2 cm below the diaphragm and extended up to the upper part of the aortic arch, enabling visualization of the heart and pulmonary arteries up to the subsegmental level. Images were immediately analyzed by the on-call radiologist, who diagnosed PE based on the presence of pulmonary arterial filling defects.
Offline image analysisAll MDCT scans were retrospectively reviewed by two independent radiologists (with 4 and 13 years of experience, respectively) who were blinded to clinical data, results of echocardiography and outcomes. The readers scored pulmonary arterial thrombus load using the system proposed by Mastora et al.7 The widths of the ventricular chambers were evaluated based on a single axial image obtained at the plane of maximal visualization of the ventricular chambers, which was typically at the level of the mitral valve. Axes were measured in diastole on a single transverse scan perpendicular to the long axis of the heart and were defined as the largest distance between the inner aspect of the interventricular septum and the ventricular free wall.14 The right ventricle was considered dilated if the right ventricular chamber was wider than the left ventricular chamber along the short axis.
Vascular measurements for the diameters of the pulmonary artery, aorta and azygos vein were also obtained used adjusted multiplanar images in the plane perpendicular to the long axis of the vessel being considered and were acquired using electronic calipers. The pulmonary artery was measured near its branching, the aorta at the middle third of its ascending portion and the azygos vein where it faced the right tracheal wall.
Statistical analysisAll variables were tested for normality using the Kolmogorov-Smirnov test. If normal, values are presented as mean values ± standard deviation. If the distribution was skewed, values are presented as medians, first and third quartiles. Correlations were analyzed with the Pearson correlation. Results are presented as coefficients of correlation (r). The area under the receiver operating characteristic curve (AUROC) was used for discrimination; this provides a measure of overall accuracy that is independent of the decision criterion. The criterion value with the highest accuracy is the value with the minimum false negative and false positive results at the same time. Statistical analyses were performed using SPSS 13.0® software (Chicago, Illinois). AUROC analysis was performed using MedCalc® software version 6.12 (MedCalc, Mariakerke, Belgium).
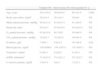
ResultsClinical dataA total of 39 consecutive patients admitted to our intensive care unit with an MDCT-confirmed diagnosis of PE were studied. All MDCT parameters were assessable in all patients. Baseline characteristics are presented in Table 1. Mean age was 59.1±19.6 years (range 22–85 years), with a majority of females (53.8%). Body mass index was high, with a mean value of 29.2±4.2 kg/m2. No differences were found in mean blood pressure or heart rate between the groups; similarly, no differences were found between groups regarding arterial blood gases, blood glucose, troponin I, estimated glomerular filtration rate or C-reactive protein on admission. D-dimers were higher in patients who died than in surviving patients (16.3±6.8 vs. 6.8±5.2 μg/l, p=0.02).
Clinical characteristics and laboratory variables at initial diagnosis.
| Total(n=39) | Survivors(n=34) | Deceased(n=5) | p | |
| Age, years | 59.1±19.6 | 56.0±19.0 | 80.3±3.9 | 0.001 |
| Body mass index, kg/m2 | 29.2±4.2 | 29.1±4.3 | 29.8±4 | NS |
| Mean arterial pressure, mmHg | 90.5±13.4 | 91.9±13.4 | 81.5±9.9 | NS |
| Heart rate, bpm | 97±19.3 | 97.6±18.8 | 92.4±24.4 | NS |
| O2 partial pressure, mmHg | 63.8±18.8 | 64.7±20 | 58.4±6.9 | NS |
| CO2 partial pressure, mmHg | 32.6±5.7 | 32.8±5.9 | 30.9±4.9 | NS |
| D-dimers, μg/l | 7.9±6.1 | 6.8±5.2 | 16.3±6.8 | 0.02 |
| Blood glucose, mg/dl | 158.9±66.6 | 159.1±67.6 | 157.8±67.1 | NS |
| Troponin I, ng/ml | 0.2±0.3 | 0.2±0.3 | 0.1±0.1 | NS |
| eGFR, ml/min/m2 | 71.9±22.9 | 74.3±22.3 | 55.7±22.7 | NS |
| C-reactive protein, mg/dl | 3.9±3.9 | 4±4.1 | 3.1±2.1 | NS |
bpm: beats per minute; eGFR: estimated glomerular filtration rate by the Modification in Diet in Renal Disease equation.
Clinical data are presented in Table 2. Most patients presented with dyspnea (69.2%), followed by chest pain (51.3%). Almost one third suffered syncope (30.8%). The most common risk factor for PE was recent major surgery (20.5%), closely followed by neoplasia (17.9%) and a prior thromboembolic event (17.9%). A typical S1Q3T3 pattern on the surface ECG was found in 23.1% of patients and in 28.2% right ventricular strain was present. The bedside echocardiogram documented mean PASP of 56.6±17.0 mmHg, with no significant differences between groups. Regarding treatment, more than 80% of patients underwent thrombolysis (82.4 vs. 100%, p=0.307). Five percent of these were high-risk patients according to the ESC guidelines, with hemodynamic instability, while 95% were in the intermediate-risk stratum.
Symptoms, risk factors and diagnostic test data at diagnosis.
| Total(n=39) | Survivors(n=34) | Deceased(n=5) | p | |
| Symptoms, n (%) | ||||
| Dyspnea | 27 (69.2) | 24 (70.6) | 3 (60.0) | NS |
| Chest pain | 20 (51.3) | 19 (55.9) | 1 (20.0) | NS |
| Cough | 4 (10.3) | 4 (11.8) | 0 (0.0) | – |
| Syncope | 12 (30.8) | 9 (26.5) | 3 (60.0) | NS |
| Risk factors, n (%) | ||||
| Recent major surgery | 8 (20.5) | 7 (20.6) | 1 (20.0) | NS |
| Neoplasia | 7 (17.9) | 7 (20.6) | 1 (17.9) | NS |
| Prior pulmonary embolism/DVT | 7 (17.9) | 1 (20.6) | 0 (0.0) | – |
| Diagnostic tests, n (%) | ||||
| Electrocardiogram | ||||
| S1Q3T3 pattern | 9 (23.1) | 8 (23.5) | 1 (20.0) | NS |
| Inverted T waves in V1–V3 | 11 (28.2) | 9 (26.5) | 2 (40.0) | NS |
| Echocardiogram | ||||
| PASP, mmHg | 56.6 ± 17.0 | 55.7 ± 15.1 | 64.0 ± 36.8 | NS |
DVT: deep vein thrombosis; PASP: pulmonary artery systolic pressure.
There were five deaths, three of them in-hospital (7.7%). None was due to bleeding complications. Median time to death was six days (range 1–40 days). The in-hospital combined endpoint of clinical deterioration occurred in 10.3% of patients. During the three-year medium-term follow-up, all-cause mortality was 12.8%.
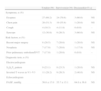
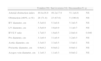
Quantitative measurementsResults of the MDCT variables are shown in Table 3. Reflecting the overall severity of the population, the arterial obstruction index was over 40% in 71.8% of patients, with a mean of 49.4±16.9%. Although this index correlated significantly with age, heart rate, troponin I and RV/LV ratio (Table 4), it was not predictive of medium-term mortality. This high arterial obstruction index was accompanied by a very high mean RV/LV ratio of 1.7±0.5. This variable differed significantly between the groups, with higher values in patients who died during follow-up (2.0±0.4 vs. 1.6±0.5, p=0.046). None of the other radiological variables correlated significantly with mortality. Patients who underwent thrombolysis had similar RV/LV ratios to patients not receiving thrombolysis (1.6±0.7 vs. 1.7±0.5, p=0.407).
Main computer tomography pulmonary angiography findings.
| Total(n=39) | Survivors(n=34) | Deceased(n=5) | p | |
| Arterial obstruction index | 49.4±16.9 | 49.2±17.9 | 51.1±8.6 | NS |
| Obstruction ≥40%, n (%) | 28 (71.8) | 23 (67.6) | 5 (100.0) | NS |
| RV diameter, cm | 5.3±0.8 | 5.3±0.8 | 5.3±0.5 | NS |
| LV diameter, cm | 3.5±0.9 | 3.6±0.9 | 3.1±0.7 | NS |
| RV/LV ratio | 1.7±0.5 | 1.6±0.5 | 2.0±0.4 | 0.046 |
| PA diameter, cm | 3.1±0.4 | 3.1±0.4 | 3.2±0.3 | NS |
| Aortic diameter, cm | 3.3±0.5 | 3.3±0.5 | 3.5±0.1 | NS |
| PA/aortic diameter, cm | 0.9±0.2 | 0.9±0.2 | 0.9±0.1 | NS |
| Azygos vein diameter, cm | 1.1±0.3 | 1.1±0.3 | 0.9±0.2 | NS |
LV: left ventricle; PA: pulmonary artery; RV: right ventricle.
Correlations of clinical, laboratory and echocardiographic data with MDCT parameters.
| Arterial obstruction index | RV/LV ratio | |||
| Pearson coefficient | p | Pearson coefficient | p | |
| Age, years | 0.373 | 0.019 | 0.353 | 0.027 |
| Heart rate, bpm | 0.432 | 0.006 | 0.366 | 0.022 |
| Troponin I, ng/ml | 0.446 | 0.012 | 0.315 | 0.085 |
| PASP, mmHg | 0.318 | 0.106 | 0.238 | 0.232 |
bpm: beats per minute; PASP: pulmonary artery systolic pressure.
On AUROC analysis, the best RV/LV ratio cut-off to predict medium-term mortality in this intermediate- to high-risk PE population was 1.81, with a c-statistic of 0.78 (95% confidence interval [CI], 0.60–0.96). Patients with an RV/LV ratio of more than 1.8 had 11-fold higher mortality than patients with RV/LV ratio <1.8 (3.8% vs. 38.8%, p<0.001). This compares with an established risk marker in PE, troponin I, which, in our population, yielded a c-statistic of 0.66 (95% CI, 0.34–0.97) for medium-term mortality.
Sensitivity and specificity (95% CI) of RV enlargement on MDCT for predicting death during follow-up were 80.0% and 76.5%, respectively. Negative and positive predictive values of RV enlargement on MDCT for medium-term all-cause mortality were 96.3% (95% CI, 81.0–99.9%) and 33.3% (95% CI, 9.9–65.1%), respectively. The RV/LV ratio had good calibration (Hosmer-Lemeshow test, p=0.594).
DiscussionThe results of our study suggest than in this severely ill, intermediate- to high-risk PE population, only RV/LV ratio had the ability to predict medium-term mortality. Other radiological parameters, including azygos vein diameter, aortic diameter, pulmonary artery diameter and arterial obstruction index, showed no correlation with the endpoint of interest. Analysis of the data on survivors and non-survivors clearly demonstrated a significant difference in mean RV/LV ratios between these groups.
Follow-up all-cause mortality was 12.8%, similar to the rate seen in larger studies, suggesting that our sample is a representative cohort of PE patients. However, most studies report short-term (usually 30–90-day) mortality,11,13 whereas we report three-year follow-up data.
Although echocardiography has long been recognized as a rapid, non-invasive and sensitive method for demonstrating RVD in acute PE patients, it is not routinely performed due to its limited availability in emergency rooms and poor image quality in some patients. As MDCT has become the favored diagnostic method in acute PE, its emergence as a diagnostic tool that can simultaneously risk-stratify the patient is of great value. Arterial obstruction index and RV/LV ratio are the most extensively studied prognostic variables in patients with PE. The current literature is not clear regarding the association of radiological indices of PE severity and morbidity and mortality, especially in predicting long-term outcomes. Moreover, most studies only include patients with less severe forms of PE, a fact that is highlighted by the low arterial obstruction and RV/LV indices reported.5,11,12 Two studies focused only on MDCT findings in massive PE, using different definitions. Ocak et al. studied three patients with massive PE and concluded that reduced left atrial and pulmonary vein diameters were important findings on MDCT.15 Lim et al. reported data on 14 patients with acute massive PE, concluding that MDCT identified patients with right ventricular dysfunction with high sensitivity and specificity, a finding of relevance in hospitals without echocardiography available around the clock.7
One question that arises is why arterial obstruction index (or PA thrombus load) was not associated with mortality. Although correlated with troponin increase and RV/LV ratio in this intermediate- to high-risk population, it did not predict RV failure or death. Our results are in agreement with those of Collomb et al.16 and Ghaye et al.,14 supporting the idea that the most important prognostic factor is how the RV responds to the sudden increase in pulmonary vascular resistance and not the extent of the thrombus burden in the pulmonary bed. Several authors suggest that it is uncoupling of RV resources from the pulmonary arterial load, rather than obstruction, that causes RV failure.17,18 This is further evidence that fixed variables, such as obstruction index and pulmonary systolic pressure, are unable to predict morbidity, as they do not reflect RV-PA coupling. Added to the fact that calculation of the arterial obstruction index is difficult and time-consuming, the effectiveness of this index in the acute setting remains to be proven.
The RV/LV ratio, in contrast, reflects RV volume and pressure overload and thus reflects the pathophysiological processes leading to heart failure and death. Leftward shifting of the interventricular septum leads to impairment of left ventricular distensibility and pericardial constraint, limiting left ventricular filling and cardiac output. At the same time, acute RV dilatation aggravates tricuspid regurgitation, itself worsening RV performance. Several reports5,6,14,19,20 and a meta-analysis13 suggest that an RV/LV ratio >1.0 (or 0.9 in reconstructed four-chamber views) is a strong prognostic marker in patients with acute PE. Although there is some evidence that reconstructed four-chamber views may be superior to axial views for the identification of high-risk patients,19 several studies have found robust prognostic value using standard axial acquisitions to calculate the RV/LV ratio.11,12,20
In a large retrospective series of 431 patients, 30-day mortality was 15.6% in patients with RV enlargement (reconstructed four-chamber views), defined as RV/LV ratio >0.9 on MDCT, compared to 7.7% in those without this finding.6 In the above-mentioned meta-analysis of two studies (with two different RV/LV ratio thresholds, 1.5 and 1.0) including 191 normotensive patients with PE, a 58% (95% CI, 51–65%) overall negative and a 57% positive (95% CI, 49–64%) value of RV dilatation were reported on MDCT for predicting early death, yielding a relative risk for in-hospital mortality of 2.28 (95% CI, 0.9–5.9).13 Our study extends these findings to a population of severely ill patients (all with RV/LV ratio >1.0) and demonstrates that patients with RV/LV ratio >1.8 have an 11-fold higher risk of mortality during medium-term follow-up. These results are comparable to those reported by Ghuysen et al.,14 in which patients with a mean RV/LV ratio of 1.52 had a mortality of 25%.
To date, no study has demonstrated a clear benefit of thrombolysis over an anticoagulation-only strategy in intermediate-risk patients,3 although a multicenter trial is currently underway to assess the value of thrombolysis in these patients.21 The majority of our population underwent thrombolysis, due to the extensive thrombus burden (72% of patients with >50% arterial obstruction index), severe RV dilatation and elevated markers of myocardial necrosis in most patients. An elevated RV/LV ratio may identify high-risk patients who will benefit most from thrombolysis. However, the low positive predictive value of the RV/LV ratio may preclude its use to justify treatment escalation.
Our study is limited by its retrospective design and the small number of patients. Moreover, due to the characteristics of the population, selected in an emergency room setting, significant heterogeneity among patients, particularly regarding comorbidities, cannot be excluded. However, this reflects the actual population referred to our hospital with suspected or confirmed PE. The echocardiograms were not performed by the same operator and hence we do not provide quantitative data on chamber dimensions or RV function. Although the MDCT scans were immediately interpreted by the on-call radiologist, all exams were thoroughly reviewed by two radiologists who were blinded to outcomes and to echocardiography results, who confirmed the diagnosis of PE in all patients. The high usage of thrombolytic therapy may have influenced the mortality results. None of the MDCT scans were ECG-gated.
In conclusion, in this selected intermediate- to high-risk PE population with markers of severe right ventricular dysfunction, most of whom were treated with thrombolysis, only the MDCT-derived RV/LV ratio was predictive of medium-term death. Regular reporting of this parameter by the radiologist, jointly with the diagnosis of PE, may help the attending physician to risk-stratify PE patients.
Ethical disclosuresProtection of human and animal subjectsThe authors declare that no experiments were performed on humans or animals for this study.
Confidentiality of dataThe authors declare that they have followed the protocols of their work center on the publication of patient data and that all the patients included in the study received sufficient information and gave their written informed consent to participate in the study.
Right to privacy and informed consentThe authors declare that no patient data appear in this article.
Conflicts of interestThe authors have no conflicts of interest to declare.
