


Cardiac magnetic resonance imaging (MRI) is increasingly used in clinical practice due to its versatility. T1 mapping of the myocardium, a recently introduced MRI technique that is becoming available enables quantitative tissue characterization, overcoming some of the limitations of late enhancement. This promising technique has the ability to identify diffuse myocardial fibrosis and is beginning to be used in the diagnostic and prognostic assessment of several heart diseases.
In this review, we start by explaining the physical principles of myocardial T1 mapping and possible confounding factors in its measurement. We then analyze the evidence supporting its potential usefulness as a complement to the existing cardiac MRI methods. Finally, we discuss the current limitations of T1 mapping and possible areas of future research.
A ressonância magnética (RM) cardíaca é um método de diagnóstico crescentemente utilizado pela sua versatilidade. O mapeamento do tempo T1 miocárdico, uma técnica de RM introduzida há alguns anos e que começa a estar clinicamente disponível, proporciona uma caracterização tecidular quantitativa, permitindo ultrapassar algumas limitações da avaliação de realce tardio. Esta técnica tem mostrado resultados promissores na identificação de fibrose difusa e começa a ser utilizada no diagnóstico e na avaliação prognóstica de várias patologias cardíacas. Neste artigo de revisão começamos por descrever os princípios das sequências de RM utilizadas no mapeamento miocárdico de T1, bem como os fatores que influenciam a sua medição. De seguida examinamos a evidência referente à sua utilidade potencial como complemento às técnicas de RM existentes em contextos clínicos diversos. Por fim, discutem-se as limitações atuais do mapeamento T1 e possíveis áreas de investigação futura.
Magnetic resonance imaging (MRI) has been increasingly used in the assessment of multiple heart diseases. The versatility of this technique makes it possible to obtain anatomical and functional information, including volume measurement, flow evaluation, myocardial perfusion and tissue characterization.1 When assessing the myocardium, the search for edema and fibrosis assumes particular importance given the diagnostic and prognostic implications.2 The study of myocardial edema is usually performed with T2-weighted images, while the evaluation of fibrosis generally involves the production of T1-weighted images acquired after administration of paramagnetic contrast (late enhancement technique). In both cases, the images obtained translate signal intensity into arbitrary units expressed on a gray scale. This classic approach has three main limitations: first, the analysis3 usually involves visual estimation and is therefore subjective; second, the images are analyzed by making a comparison with an area considered healthy, which may limit its sensitivity in the detection of diffuse changes, especially at an early stage; finally, the late enhancement technique used for fibrosis detection requires the administration of paramagnetic contrast, which is contraindicated in some patients.
Myocardial mapping techniques thus emerge as an alternative to overcome these limitations, providing quantitative information that is potentially useful in the diagnostic and prognostic evaluation of various heart diseases and in understanding the underlying pathophysiological processes. In this narrative review article, we attempt to examine, in a non-exhaustive manner, the evidence supporting the use of T1 myocardial mapping as an add-on to existing MRI techniques. We present some basic technical concepts,4–6 the advantages and limitations, and discuss the potential clinical applications of myocardial T1 mapping.
T1 mappingT1 is estimated by sampling the signal at different points of the exponential recovery curve of the longitudinal magnetization (Mz) after disruption to the equilibrium (Figure 1).7 The inversion-recovery methods are the most widely used because they are available on clinical equipment as a result of their demonstrated high accuracy.7,8 The Look-Locker (LL) method, which enables more than one image after each inversion to be acquired, has been adapted to include synchronization with the electrocardiogram (ECG) in a method called Modified LL (MOLLI).9,10 This process is usually performed in apnea, which can last up to 20 seconds, depending on the heart rate (Figure 2). To reduce acquisition time, and to enable T1-mapping in patients with lower respiratory capacity, a sequence called short MOLLI (ShMOLLI) was developed that reduces apnea to nine cardiac cycles (∼9 s for 60 bpm).11 It is also possible to perform T1 mapping using saturation pulses. Although less accurate than the inversion-recovery methods, the saturation method is more accurate than the previous ones, since each point on the curve is acquired after a new pulse, meaning that samples taken are independent of each other.8 The most commonly used method in this context is SAturation recovery Single Shot Acquisition (SASHA),12 in which ten measurements are taken equidistantly and synchronously with the ECG. Regardless of the advantages and disadvantages of each method, it is important to keep in mind that none of them are able to provide the true myocardial T1 time, but rather provide estimates of this value.
 and each image has a different T1-weighting. This is possible by changing the acquisition parameter (i.e. inversion time (IT)) for each image, and which corresponds to a point on the exponential recovery curve of the longitudinal magnetization Mz. The scheme represented is MOLLI 5(3)3 composed of two inversions each followed by a set of five or three T1-weighted images, respectively, and separated from each other by three heartbeats (see ECG synchronisation in Figure 2). The images are subsequently reordered (b) according to their respective TI. Finally, (c) for each pixel, the parameters of a known model, including the time T1, are adjusted in order to describe the temporal evolution of the signal. All estimated T1 values are presented in a final T1 map image. Legends: Mz: longitudinal magnetization.")
Standard structure for T1 map acquisition in cardiac MRI. A series of images is acquired (a) and each image has a different T1-weighting. This is possible by changing the acquisition parameter (i.e. inversion time (IT)) for each image, and which corresponds to a point on the exponential recovery curve of the longitudinal magnetization Mz. The scheme represented is MOLLI 5(3)3 composed of two inversions each followed by a set of five or three T1-weighted images, respectively, and separated from each other by three heartbeats (see ECG synchronisation in Figure 2). The images are subsequently reordered (b) according to their respective TI. Finally, (c) for each pixel, the parameters of a known model, including the time T1, are adjusted in order to describe the temporal evolution of the signal. All estimated T1 values are presented in a final T1 map image. Legends: Mz: longitudinal magnetization.
3(3)5 in which three inversions are performed. The first two are followed by three images with different inversion times separated from each other by a heartbeat and the last inversion with five images. Between inversions there is a magnetization recovery period which is represented inside the brackets and which corresponds to three heartbeats. In this way, the acquisition lasts 17 heartbeats, obtaining 11 images in total. These are ordered according to the time elapsed since the respective inversion, in order to perform the adjustment of the exponential model. Legends: ECG: electrocardiogram; Mz: longitudinal magnetization.")
Scheme of synchronisation of the MOLLI method with the ECG. The acquisition represented is MOLLI 3(3)3(3)5 in which three inversions are performed. The first two are followed by three images with different inversion times separated from each other by a heartbeat and the last inversion with five images. Between inversions there is a magnetization recovery period which is represented inside the brackets and which corresponds to three heartbeats. In this way, the acquisition lasts 17 heartbeats, obtaining 11 images in total. These are ordered according to the time elapsed since the respective inversion, in order to perform the adjustment of the exponential model. Legends: ECG: electrocardiogram; Mz: longitudinal magnetization.
Much of the early enthusiasm in the development of myocardial mapping was driven by interest in measuring extracellular volume fraction (ECV, sum of intravascular and interstitial components). The expansion of the ECV by interstitial fibrosis is a common process in several myocardial diseases and an important diagnostic and prognostic marker.4,13 Evaluation of the ECV may be particularly useful in the differential diagnosis between physiological and pathological hypertrophy, since in the case of the former, the ECV proportion is not increased (unlike in pathological processes) (Figure 3C). The determination of the ECV fraction using MRI involves the creation of pre-contrast T1 maps (also called “native T1”) and post-contrast (acquired at least 15 minutes after its administration). The ECV is then calculated based on the values of these maps, using the ratio of the differences between post- and pre-contrast (1/T1) myocardial relaxation rates and post- and pre-contrast blood relaxation rates. Calculation of the ECV usually requires knowledge of the hematocrit value since this can influence the transfer of contrast from the blood to the tissues. Alternatively, a theoretical hematocrit value can be used, although the error propagated to the ECV is not insignificant when the hematocrit is too low.14 It is important to realize that the measurement of the ECV fraction is dependent on the applied contrast dose and renal clearance, among other factors.4 Other sources of error include motion (cardiac or respiratory), arrhythmias, or any other factor that impairs the correct overlap of the native and post-contrast T1 maps.
 in different pathological situations: A - T1 maps of a patient with hypertrophic cardiomyopathy and mean myocardial T1 time of 1085 ms (reference 950-1050 ms); B - T1 maps of a patient with cardiac amyloidosis and mean myocardial T1 time of 1170 ms (reference 950-1050 ms); C - VEC maps of a professional football player with mild left ventricular hypertrophy considered physiological and with mean VEC of 24%.")
T1 and VEC maps (short basal, middle, apical and respective polar-plots) in different pathological situations: A - T1 maps of a patient with hypertrophic cardiomyopathy and mean myocardial T1 time of 1085 ms (reference 950-1050 ms); B - T1 maps of a patient with cardiac amyloidosis and mean myocardial T1 time of 1170 ms (reference 950-1050 ms); C - VEC maps of a professional football player with mild left ventricular hypertrophy considered physiological and with mean VEC of 24%.
In most clinical contexts, it is still unclear whether and under what circumstances the ECV measurement is superior to native T1, or even whether it provides relevant additional information compared to the latter parameter. Studies have provided conflicting results in this regard.15
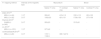
Reference valuesA correct evaluation and interpretation of myocardial mapping depends on the existence of reliable reference values. It is important to remember that the normal values of myocardial T1 times are influenced by many factors, including magnetic field strength (1.5 or 3.0 Tesla), as shown in Table 1, as well as the sequence used (which in turn varies according to device manufacturer and even device model).16–21 Other factors that influence the T1 time include heart rate and the region of the heart being assessed (with slightly higher values in the apical segments). Ideally, each center should establish its own reference values using the devices and sequences available to it in healthy volunteers.
Reference values for T1±standard deviation (SD) native and contrast-enhanced in ms, for myocardium and blood.
| T1 mapping method | Intensity of the magnetic field | Myocardium | Blood | ||
|---|---|---|---|---|---|
| Native T1 (ms) | T1 contrast (ms) | Native T1 (ms) | Contrast T1 (ms) | ||
| Dabir 201419 | |||||
| MOLLI (n=34) | 1.5 T | 950±21 | 415±113 | 1551±115 | 291±122 |
| MOLLI (n=32) | 3.0 T | 1052±23 | 421±131 | 1736±139 | 277±106 |
| Piechnik 201011 | |||||
| ShMOLLI (n=342) | 3.0 T | 953±23 | - | 1515±91 | - |
| Liu 201317 | |||||
| MOLLI (n=1231) | 1.5 T | 977±42 | - | - | - |
| vonKnobelsdorff 201322 | |||||
| MOLLI (n=60) | 3.0 T | 1157.1-1180.6 | 399.7-427.3 | - | - |
Legends: MOLLI: modified Look-Locker method; ShMOLLI: short Look-Locker modified.
Several recent studies have consistently demonstrated a good correlation between histological indices of interstitial fibrosis and native T1, post-contrast T1, and ECV values,23 thus establishing MRI myocardial mapping as a noninvasive tool in the study of fibrosis and interstitial remodeling of the myocardium.24–27 This technique thus increases the ability of MRI to provide useful diagnostic and prognostic information in various scenarios, thus justifying its increasing use in clinical practice.
Aortic stenosis and hypertensive heart diseaseThe differential diagnosis of left ventricular hypertrophy (LVH) is a common clinical challenge, especially when distinguishing between primary myocardial disease, such as hypertrophic cardiomyopathy (HCM), and hypertrophy secondary to pressure overload from aortic stenosis (AS) or hypertension. All of these diseases culminate in adverse myocardial remodeling that can be identified by MRI.4
Similar to hypertension, aortic stenosis leads to left ventricular overload with the consequent activation of prohypertrophic and pro-fibrotic pathways.4 Diffuse interstitial fibrosis appears to be a key determinant in the development of systolic and diastolic dysfunction in patients with AS and can be assessed noninvasively by T1 mapping.28 AS is associated with increased native T1 and ECV times, both of which correlate highly with the presence and amount of interstitial fibrosis documented by endomyocardial biopsy.25,29 These results have been reported in several studies and demonstrate the potential of T1 mapping in the diagnosis of interstitial fibrosis.30,31 T1 measurements also appear to have potential in the prognostic assessment of patients with AS: individuals with greater native T1 prolongation have a higher risk of all-cause death or hospitalization for heart failure (HF).32
Left ventricular hypertrophy secondary to hypertension is also associated with changes similar to those seen in AS, such as increased ECV and native T,33,34 albeit to a milder degree. These results, however, are not seen in the early phase of the disease: hypertensive individuals who do not have LVH do not present significant changes in T1 mapping, again demonstrating the ability of MRI to document ventricular remodeling specifically.34
Hypertrophic cardiomyopathyHypertrophic cardiomyopathy is characterized by LVH not secondary to pressure overload and is accompanied by the presence of dysmorphic cardiomyocytes with loss of their structural alignment, fascicular disarray, and interstitial fibrosis.5 The interstitial fibrosis and extracellular matrix expansion characteristic of HCM can be identified by MRI. Several studies demonstrate a change in T1 map values in patients with HCM, with prolongation of native T1 time, increased ECV and decreased post-contrast T1 value (Figure 3A).34–38 Even in myocardial areas without late enhancement, T1 mapping identifies diffuse interstitial fibrosis, suggesting the presence of subclinical myocardial disease not demonstrable by late enhancement.35 Additionally, post-contrast T1 time correlates with echocardiographic indices of diastolic dysfunction in HCM, pointing to a mechanistic association between diffuse interstitial fibrosis and diastolic dysfunction.38
Carriers of HCM-associated mutations with no phenotypic expression (genotype-positive, phenotype-negative individuals) also show changes in T1 maps, such as expansion of the ECV.39 These findings suggest that myocardial remodeling in HCM occurs dynamically and precedes the development of LVH, so MRI has the potential to identify individuals at a preclinical stage of disease.4
The use of myocardial T1 mapping for differentiating between a diagnosis of HCM and hypertensive heart disease is an attractive concept that has been explored in some studies, with discordant results. In a study of 95 patients with HCM and 69 patients with hypertensive heart disease, the native T1 value showed a good discriminative value, superior to that of maximum parietal thickness, total myocardial mass, and ECV value.37 In a study with a similar design that included 34 patients with HCM and 41 individuals with hypertensive heart disease, the native T1 value was similar in these two groups, and was thus did not enable a differential diagnosis between the two clinical entities.40 Further and larger studies will probably be needed to ascertain whether myocardial T1 mapping can be useful in this context.
In the future, this MRI modality may play a role in stratifying the prognosis of HCM. A study in 100 patients with HCM demonstrated a statistically significant increase in native T1 times in individuals with ventricular tachycardia episodes when compared with patients without arrhythmic events.41 Other studies point to ECV, as opposed to native T1, as a better predictor of sudden cardiac death risk in HCM.42 Thus, T1 mapping may be an alternative or complementary risk marker to late enhancement. It remains to be seen which T1 parameter is best for assessing arrhythmic risk.
Infiltrative diseasesMyocardial deposition of amyloid protein or lipids or glycogen responsible for the development of cardiac amyloidosis and Anderson-Fabry disease, respectively, lead to increased left ventricular thickness and are differential diagnoses of causes of LVH. Although late enhancement can be assessed in these diseases, it is a suboptimal marker of cardiac involvement in infiltrative myocardiopathies given its diffuse uptake and difficult quantification.23 T1 mapping thus emerges as an alternative or complement in the evaluation of these diseases.
It is now recognized that cardiac amyloidosis is accompanied by increased ECV and marked prolongation of native T1 time (Figure 3B).43–47 These findings correlate with markers of systolic and diastolic dysfunction in patients with light chain deposition disease, suggesting that increased native T1 reflects greater disease severity.44 Increases in ECV and native T1 have also been shown to be independent risk factors for all-cause mortality in this population, and have potential for the monitoring of treatment response.44,45,48 Additionally, native T1 is prolonged in transthyretin amyloidosis, although the values are lower compared to light chain deposition disease.45 Still, in both cases, the native T1 time is significantly longer than that observed in HCM, suggesting that T1 mapping findings may be important in the differential diagnosis between the two diseases.45 Given the strong association between the values shown on T1 maps and cardiac amyloidosis, the absence of changes in measured T1 values can virtually rule out this diagnosis.4,47
In Anderson-Fabry disease, a different pattern is observed in T1 mappinh, with intra-myocyte accumulation of glycosphingolipids (not accompanied by extracellular matrix expansion) causing decreased native T1 times despite normal ECV values.49–51 These findings are highly characteristic, allowing T1 mapping to be used as a screening test. Decreased native T1 is still present in about half of the patients with Anderson-Fabry disease (without established LVH), thus enabling the use of T1 mapping for the diagnosis of disease at a subclinical stage.49,50 Given the existence of specific therapies for Anderson-Fabry disease, namely enzyme replacement therapy, the correct and timely diagnosis of this syndrome is crucial, since the efficacy of enzyme replacement therapy seems to decrease with disease progression.50
Similar to Anderson-Fabry disease, iron overload heart diseases and glycogen storage diseases also have decreased native T1 time.52,53 Thus, decreased native T1 should raise the diagnostic suspicion of these disorders.
Dilated cardiomyopathyDilated myocardiopathy (DCM) is caused by several pathophysiological processes, such as extracellular matrix remodeling, myofibroblast transformation, and cardiomyocyte loss. They culminate in inflammation, myocardial fibrosis, and systolic dysfunction.4 These changes often evolve in a prolonged manner, presenting a long preclinical phase.5,53 Thus, T1 mapping may play a role in the early diagnosis of the disease. DCM causes a prolongation of the native T1 time, increased ECV and decreased post-contrast T1 time.35,37,54,55 Similar to observations in other diseases, increased ECV in DCM correlates with interstitial fibrosis documented by endomyocardial biopsy.55 The parameters obtained by T1 mapping also correlate well with markers of systolic and diastolic ventricular dysfunction in DCM. Native T1 time is also an independent predictor of adverse events in this population, such as all-cause death or hospitalization for HF.55 This association is independent of other prognostic markers, such as left ventricular ejection fraction or late enhancement, supporting a specific pathophysiological role of diffuse interstitial fibrosis in this disease.56
There is also growing evidence that myocardial T1 mapping could be used as an early marker of cardiotoxicity in cancer therapy.57
MyocarditisT1 mapping can be useful in the diagnosis of myocarditis. The phenomena of edema, hyperemia and vascular leakage secondary to inflammation lead to an increase in myocardial free fluid identifiable by MRI.58 These changes are reflected in a prolonged native T1 time, both in patients with acute active myocarditis and in patients with disease in resolution, presenting, in some studies, a positive and negative predictive value >95%.58 In these individuals, native T1 may even have a higher diagnostic acuity than late gadolinium enhancement and T2 weighting, two parameters frequently used in the diagnosis of myocarditis.27,58 However, there is some evidence that T2 mapping may be more specific than T1 mapping in detecting inflammation, since the latter parameter is also affected by increased fluid content in more chronic situations, such as in scar tissue areas.6
In addition to native T1, ECV is also increased in acute myocarditis.59 However, when compared with native T1, the latter seems to have greater diagnostic acuity in this population,60 meaning that its use is currently listed in the 2018 recommendations of the Society for Cardiovascular Magnetic Resonance for the evaluation of non-ischemic myocardial inflammation.6
Acute myocardial infarction and chronic coronary syndromeT1 mapping can also be used in the assessment of acute myocardial infarction (AMI) by identifying edema at the site of infarction.61 When compared with T2-weighted assessment of myocardial edema, native T1 appears to have superior diagnostic acuity for non-ST-elevation myocardial infarction on ECG and similar for ST-elevation myocardial infarction. The observed changes have prognostic importance since the time of native T1 at the infarct core correlates with the risk of ventricular remodeling and adverse clinical events. In addition to native T1, ECV is also increased in AMI, enabling delimitation of necrosis area.62–64 In the case of prior AMI, T1 mapping correlates with the location, extent and transmurality of the infarct scar.65 However, AMI scar assessment should be performed cautiously: the occurrence of adipose metaplasia and intra-cicatricial adipose tissue development can lead to a distortion of native T1 times and lead to highly variable T1 values (from normal to prolonged).66 It is not, however, expected that T1 mapping will replace late enhancement assessment in this context, since the latter is well validated and allows the assessment of the degree of infarct transmurality and identification of the “no-reflow” phenomenon.
Implications for clinical practiceDespite the evidence presented regarding the usefulness of T1 mapping in each of the diseases under analysis, its actual clinical use is distinct. In diseases such as Anderson-Fabry or amyloidosis (two extremes of the spectrum), the T1 mapping technique has greater potential to be used in diagnosis, due to the greater differentiation between diseased and healthy tissue. However, in settings such as hypertensive heart disease, AS, or HCM, affected tissues may present values close to or even within the reference ranges, with great overlap between diseases. Although the mean values are higher in some diseases than in others, the differences are relatively small, which greatly limits the specificity for a given disease. This limitation means there must be caution in its use and suggests that interpretation should always be made in view of the clinical context and other imaging findings. In this regard, it is important to note that in most clinical situations, T1 mapping complements (and does not replace) the information provided by late enhancement. Pathologies characterized by diffuse interstitial fibrosis will probably be those where this new parameter will assume greater relevance. However, since interstitial fibrosis and replacement fibrosis processes are not mutually exclusive, T1 mapping may also be useful in diseases where localized late enhancement is usually observed, often coexisting with diffuse interstitial fibrosis. In these contexts, it is possible that the main information provided by T1 mapping is principally prognostic rather than diagnostic.
Limitations and areas for future researchOne of the main current limitations of T1 mapping is the relative lack of standardization of the technique. Despite recent progress in this area, the existence of different sequences and the susceptibility of the results to small technical variations mean that there are currently no universal reference values, but only wide ranges, which makes comparability between tests difficult. In fact, as it is a quantitative parameter that is dependent on equipment calibration, equipment characteristics, as well as other intrinsic patient parameters such as field homogeneity at the site of interest, it is a technique that is highly dependent on the environment in which it is applied. A practical consequence of this limitation is that comparative studies should, whenever possible, be performed on the same device and with the same sequence. In addition, obtaining the sequences for mapping requires the purchase of software packages, entailing additional costs that are not accessible to all centers. Access to the necessary post-processing programs is also limited.
Also, from a technical point of view, it is important to mention the reduced spatial resolution currently achievable in T1-weighted maps compared to RT images, which may limit the detail of tissue characterization possible with this technique.
As the technique matures, it is expected that research will focus less on the technical component and more on its clinical applications. Unanswered questions include whether T1 mapping can replace late enhancement in specific situations, its incremental diagnostic and prognostic value relative to existing techniques, and how the results might help guide treatment.
ConclusionMyocardial T1 mapping is an emerging MRI technique that enables quantitative tissue characterization. Used alongside the usual techniques, T1 mapping enables the evaluation of fibrosis which, when present in a diffuse form, was practically only accessible through myocardial biopsy. In addition, where there is localized fibrosis, it can complement the assessment performed with RT. The information obtained is potentially useful in the diagnosis and prognostic evaluation of several cardiac diseases, especially in the differential diagnosis of left ventricular hypertrophy, in the suspicion of hypertrophic cardiomyopathy or infiltrative diseases, among others. The clinical utility of this tool and its possible implications in the diagnosis and treatment of multiple cardiac pathologies are an active and rapidly expanding area of research.
Conflicts of interestThe authors have no conflicts of interest to declare.
