


In severe aortic stenosis (AS), the impact of aortic valve replacement (AVR) on left ventricular (LV) systolic function assessed by strain and measured by echocardiography or cardiac magnetic resonance (CMR) has been controversial. We aimed to investigate LV systolic myocardial function changes six months after AVR using global longitudinal (GLS), circumferential (GCS) and radial (GRS) strain derived from CMR imaging.
MethodsWe included 39 severe AS patients (69.3±7.8 years; 61.5% male) with preserved LV ejection fraction (LVEF) who were recruited as part of the EPICHEART study and underwent successful AVR (aortic valvular area: 0.8 cm2 (IQR: 0.2) pre- to 1.8 cm2 (IQR:0.5) post-AVR). Structural and functional parameters were assessed at baseline and six months after AVR, including LV GRS, GCS and GLS analysis by CMR, using cine short-axial and two-, three-, and four-chamber long-axial view. Comparison between baseline and postoperative LV remodeling was performed using Student t-test and Wilcoxon test.
ResultsAt six-month follow-up, LV mass, end-diastolic and end-systolic volumes, stroke volume, cardiac output, lateral E/e’, tricuspid annular plane systolic excursion, right ventricular (RV) S wave velocity, GLS [-15.6% (IQR: 4.39) to -13.7% (IQR: 4.62)] and GCS [-17.8±3.58% to -16.1±2.94%] reduced significantly, while LVEF and GRS remained unchanged and lateral e’ velocity increased.
ConclusionsDespite favorable reverse LV structural and diastolic functional remodeling six months following AVR, GLS and GCS assessed by CMR reduced compared to baseline, LVEF remained unchanged. The clinical utility and timing of assessment of postoperative strain changes as a marker of systolic function progression needs further research.
Na estenose aórtica (EA), o impacto da substituição da válvula aórtica (SVA) na função sistólica do ventrículo esquerdo (VE), avaliado por strain medido por ecografia ou ressonância magnética cardíaca (RMC), ainda é controverso. Neste estudo, pretendemos investigar as alterações na função sistólica do VE seis meses após SVA, avaliadas por strain global longitudinal (SGL), circunferencial (SGC) e radial (SGR) medidos por RMC.
MétodosForam incluídos 39 doentes com EA severa (69,3±7,8 anos; 61,5% sexo masculino) com fração de ejeção do VE (FEVE) preservada, recrutados no estudo EPICHEART, que foram submetidos a SVA bem-sucedida [área valvular aórtica (AVA): 0,8 cm2 (VIQ:0,2) pré-SVA para 1,8 cm2 (VIQ:0,5) pós-SVA]. Foram avaliados parâmetros de estrutura e função, incluindo SGL, SGC e SGR do VE por RMC, através da avaliação de imagens de eixo-curto e de eixo-longo de duas, três e quatro câmaras, antes e seis meses após SVA. Os valores pré e pós-operatórios da função e estrutura do VE foram comparados com o teste t de Student e com o teste de Wilcoxon.
ResultadosAos seis meses após SVA, verificou-se redução significativa da massa do VE, volumes telediastólico e telessistólico, volume de ejeção, débito cardíaco, rácio E/e’ lateral, TAPSE e onda S do ventrículo direito (VD), tal como do SGL [-15,6% (VIQ:4,39) para -13,7% (VIQ:4,62)] e do SGC [-17,8±3,58% para -16,1 ± 2,94%), enquanto a FEVE e o SGR não sofreram alterações significativas e a velocidade e’ aumentou.
ConclusõesApesar de uma remodelagem reversa estrutural e funcional diastólica favorável seis meses após SVA, o SGL e SGC medidos por RMC diminuíram e a FEVE não sofreu alterações significativas. A utilidade clínica e o tempo após intervenção para avaliar as alterações pós-operatórias do strain, como marcador de função sistólica, requerem investigação adicional.
Aortic stenosis (AS) is the most common and debilitating heart valve disease in the Western world (prevalence of 12.4% in the elderly). AS is characterized by progressive aortic valve narrowing and adaptive left ventricular (LV) hypertrophic remodeling. Concentric LV hypertrophy maintains wall stress and LV function for many years, but, ultimately, leads to severe diastolic dysfunction, myocyte injury and myocardial interstitial and replacement fibrosis.1–6 Deterioration of systolic function as assessed by LV ejection fraction (LVEF) occurs late in the natural course of the disease7,8 and is a criteria for aortic valve replacement (AVR), despite the absence of symptoms.9–11 However, at the stage of LVEF impairment, LV remodeling is characterized by progressive replacement fibrosis, which is irreversible after valve replacement.2 The assessment of systolic function by means of global longitudinal strain (GLS) using speckle tracking echocardiography demonstrated that patients with severe AS have reduced GLS, despite having preserved LVEF. Hence, LV strain has been recently regarded has a more sensitive method than LVEF to assess LV systolic dysfunction in AS patients.2,12–14 Furthermore, impaired GLS has been associated with worse outcomes in these patients.15 The value of LV strain to assess systolic function behavior following AVR has not yet been fully established.
Although recent studies have shown an improvement in postoperative strain measurements assessed by echocardiography in patients with severe AS and preserved LVEF, the timing for detecting favorable radial (GRS), circumferential (GCS) and/or GLS changes following intervention varies among studies from seven days to 17 months.13,16–18 Cardiac magnetic resonance (CMR) is the best available method for capturing myocardial and LV changes in AS patients.19 It can be used to identify both diffuse and replacement forms of fibrosis20 and is the gold-standard for LVEF quantification.21 Results from the available studies using CMR strain analysis vary from no significant change following post-surgical AVR (SAVR)21 or post-transcatheter aortic valve implantation (TAVI),22 to an early (14 days) strain impairment following SAVR and improvement following TAVI, with subsequent (15 months) improvement in both procedures.23
Strain progression after intervention seems to depend on the assessment time and the imaging method used. Therefore, the value of strain to assess systolic function and LV remodeling after AVR is still controversial. Our objective was thus to contribute with additional data to clarify the role of strain in a CMR-assessed severe AS population.
We aimed to compare CMR-assessed GRS, GCS and GLS in AS patients with preserved LVEF before and after AVR and to explore its capacity to detect LV systolic function changes in the context of LV reverse remodeling.
MethodsStudy design and participantsPatients were recruited as part of the EPICHEART clinical trial (ClinicalTrials.gov: NCT03280433). The study population included patients with severe AS (aortic valve area (AVA) <1 cm2 or <0.6 cm2/m2 assessed by transthoracic echocardiography) referred for AVR. Exclusion criteria were prior atrial flutter or fibrillation (AF), coexisting moderate-to-severe aortic valve regurgitation or mitral valve disease, bicuspid aortic valve, LVEF <50%, stage 3-5 chronic renal failure, moderate-to-severe chronic obstructive pulmonary disease, or active malignancy. All included patients underwent detailed clinical and frailty syndrome evaluation, transthoracic echocardiography and CMR before intervention and at six months post-AVR. Patients also underwent preoperative computed tomography and invasive coronary angiography. Comorbidities were recorded (including New York Heart Association (NYHA) class, arterial hypertension, dyslipidemia, diabetes, smoking status, chronic obstructive pulmonary disease, stroke, and peripheral arterial disease), as well as ongoing medication. The Institutional Ethical Committee approved the study protocol, and all patients provided written informed consent. Figure 1 illustrates the study design and flowchart.
Transthoracic echocardiography
All echocardiographic examinations were obtained by a single experienced operator using an ultrasound system (iE33, Philips Medical Systems, Best, The Netherlands) equipped with an S5-1 transducer; images were stored digitally for subsequent offline analysis. Mitral inflow velocities were assessed in the apical four-chamber view using pulsed-wave Doppler, with the sample placed at the tips of the mitral leaflets; velocities were recorded at end-expiration. Pulsed-wave tissue-Doppler velocities were acquired at end-expiration, in the apical four-chamber view, with the sample positioned at the septal and lateral mitral annulus: systolic (S’), early-diastolic (E’) and late-diastolic (A’) velocities were measured. For all parameters, the average of three consecutive heartbeats was recorded. Aortic valve area (AVA) was calculated using the continuity equation, based on the cross-sectional area of the LV outflow tract (LVOT) and the velocity time integral (VTI) of LVOT and aortic valve, according to European and American recommendations.24,25 At six months, prosthetic valves were assessed according to the same principles as native valves. Systolic function was assessed by measuring LVEF, using the modified Simpson rule from biplane four- and two- chamber views, and systolic myocardial annular tissue velocity (S’ septal, S’ lateral and S’ mean).
Cardiac magnetic resonance imagingPatients underwent CMR at 1.5T (Siemens, Avanto, Erlangen, Germany) before and six months after AVR, including high-resolution perfusion, cine and scar imaging.
LV structure and strain analysisEnd-diastolic and end-systolic epicardial and endocardial borders from short-axis and two-, three- and four-chamber long-axis images were defined manually by a trained investigator blinded to clinical and echocardiographic parameters using cvi42® (version 5.6, Circle Cardiovascular Imaging Inc., Calgary, Canada).26 The 16-segment model was used for assessment of regional (baseline, mid-ventricular, apical) and global myocardial mechanics, including myocardial velocities and strain. Myocardial pixels were automatically tracked by the software along the cardiac cycle to generate strain measurements. Horizontal long-axis cines were tracked to derive longitudinal strain, while short-axis cines were used to derive radial and circumferential strain. Six metrics of LV morphology and function [end-diastolic volume (EDV), end-systolic volume (ESV), stroke volume (SV), LVEF, cardiac output (CO), myocardial mass (LVM)] were also recorded. Figure 2 shows the tracking of LV endocardial and epicardial borders and global LV longitudinal, circumferential, and radial strain patterns of a patient with severeAS.
 and epicardial (green) contours of the left ventricle in a four-chamber image (A) and on a short-axis view (B) using tissue-tracking, and global left ventricular longitudinal (C), circumferential (D), and radial (E) strain curves.")
Normal LV strain measurements are not defined consensually in current literature. We defined normal values based on the works of Claus et al.27 and Scatteia et al.,21 which combined different studies on CMR-assessed LV strain of healthy populations.
Statistical analysisFor both baseline and six months after intervention measurements, we reported continuous variables such as mean ± standard deviation for normally-distributed data (assessed by visual histogram inspection and Shapiro-Wilks test), and median and 25th (Q1) and 75th (Q3) percentiles or median and interquartile range (IQR) for non-normally distributed data. In case of normality disagreement between baseline and follow-up, both variables were reported as non-normally distributed to enable better comparison. Discrete variables are shown as frequencies and percentages.
First, we compared all measurements, including strain parameters, before and six months after intervention, using Student t-test or the Wilcoxon test for paired continuous variables, where appropriate, and McNemar test for paired categorical data. Then, we calculated the difference between postoperative and preoperative GLS.
Subsequently, we performed a simple linear regression to understand how baseline measurements influenced the described GLS difference. We then created a multiple linear regression model adjusting for other variables, namely age, gender, AVA, LVM and LVESV, to avoid confounding.
We also divided our patients in distinct groups according to strain measurements and behavior and compared different variables between these groups, using Student t-test for independent variables.
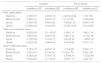
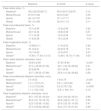
Finally, we randomly selected ten patients and repeated strain analysis conducted by the same investigator and by a different one to assess agreement and reproducibility, by variation and Bland-Altman analysis. In Bland-Altman analysis, mean differences ± 2 standard deviations for intra and inter-observer variability were -0.16±1.7% and 0.37±2.2% for GCS, -0.03±2.3% and 1.03±3.2% for GLS and 10.36±29.1% and -0.91±10.0% for GRS, respectively. Within-subject variability was 4% for GCS, 6% for GLS and 38% for GRS. The results for all LV strain parameters are shown in Table 1. GCS and GLS are considered more robust CMR-assessed strain parameters than GRS.27,28
Variation and reproducibility of left ventricular strain measurements.
| Variation | Bland-Altman | |||
|---|---|---|---|---|
| IntraMean±SD | InterMean±SD | IntraMean±SD | InterMean±SD | |
| Peak radial strain | ||||
| Baseline | 0.78±0.81 | 0.20±0.18 | 22.90±34.32 | 1.74±7.65 |
| Midventricular | 0.38±0.21 | 0.20±0.12 | 4.17±7.65 | -2.08±6.38 |
| Apical | 0.33±0.25 | 0.25±0.33 | -3.62±21.23 | 0.84±12.47 |
| Global | 0.38±0.33 | 0.12±0.09 | 10.36±14.53 | -0.91±4.99 |
| Peak circumferential strain | ||||
| Baseline | 0.05±0.05 | 0.11±0.06 | -0.08±1.12 | 1.66±1.14 |
| Midventricular | 0.06±0.05 | 0.06±0.04 | -0.22±1.47 | -0.10±1.36 |
| Apical | 0.12±0.09 | 0.12±0.11 | -0.20±2.34 | -1.34±2.16 |
| Global | 0.04±0.02 | 0.06±0.03 | -0.16±0.84 | 0.37±1.12 |
| Peak longitudinal strain | ||||
| Baseline | 0.18±0.13 | 0.23±0.14 | 1.73±2.08 | 2.32±1.71 |
| Midventricular | 0.06±0.07 | 0.10±0.05 | 0.22±1.76 | 0.99±1.95 |
| Apical | 0.26±0.20 | 0.16±0.16 | -0.50±4.19 | -1.52±2.69 |
| Global | 0.06±0.05 | 0.11±0.07 | -0.03±1.17 | 1.03±1.61 |
Values are mean±SD.
Abbreviations: LV: left ventricular.
Our analyses were performed using IBM SPSS Statistics, version 24. P values are two-sided, and values <0.05 were considered statistically significant. Our results encompass both positive and negative measurements. In order to improve clarity regarding postoperative remodeling, these variations were described in absolute values.
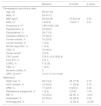
ResultsClinical and baseline imaging characteristicsWe included a total of 39 patients (mean±SD: 69.3±7.84 years; 61.5% male) with symptomatic severe AS [median AVA (IQR): 0.77 cm2 (0.23)] and preserved LVEF [median LVEF(IQR): 63.0% (9.59)] who were referred to and underwent successful AVR [post-AVR AVA: 1.81 cm2 (0.48)]. A total of nine patients had their valves replaced with mechanical protheses and 30 with biological prostheses. In our population, 84.6% of patients had hypertension, 71.8% had dyslipidemia, 46.2% had diabetes mellitus and 46.2% coronary artery disease (CAD). Among patients with CAD, one had three affected vessels, two had two affected vessels and the remaining had one affected vessel. Two patients had undergone a previous percutaneous coronary intervention. At six-month follow-up, we observed a reduction of 18.6% in patients taking angiotensin receptor blockers (ARB), accompanied by an increase of 27.8% in patients taking beta blockers (BB), of 24.3% taking antiplatelets and of 33.3% taking anticoagulants, either due to the replacement with mechanical valves or due to the development of AF which was reported in nine patients postintervention. We studied potential differences and associations in replacement with biological and mechanical valves with, as well as the development of AF with pre- and postoperative LV strain measurements and no statistically significant associations were found. Table 2, Table 3 and Table 4 show the clinical, echocardiographic and CMR characteristics of our population, respectively. Our preoperative assessment showed LV hypertrophy and abnormal contractility, perfusion or late gadolinium enhancement (LGE) of the myocardium assessed by CMR in a number of patients (Table 4). Abnormal results were considered if at least one segment was altered. We also documented decreased baseline strain values (Table 5), despite preserved LVEF. We considered normal GRS, GCS and GLS to be 33±7%, -23±4% and -20±3% respectively, based on the works of Claus et al.27 and Scatteia et al.,21 as stated in the Methods section. Therefore, if we consider the lower limit of the normal range to be -26%, -19% and -17% for GRS, GCS and GLS, 10 (26%), 24 (62%) and 29 (74%) patients had GRS, GCS or GLS values under that threshold, respectively. If we consider the median values in our population [GCS: -18.02% (4.9); GLS: -15.60% (4.4)], GCS is nearer the lower limit of the normal range, compared to GLS. We divided our patients according to impaired and non-impaired baseline GCS and GLS measurements, using cut-off values of -19% and -17%, respectively. We found a significant difference in preoperative LVEF in patients with baseline impaired GCS (preoperative LVEF of 59.4±9.07%), compared to patients with non-impaired GCS (preoperative LVEF of 67.4±6.37%), p<0.01, demonstrating that patients with impaired baseline GCS have lower LVEF.
Demographic and clinical data.
| Baseline | 6-month | p-value | |
|---|---|---|---|
| Demographic and clinical data | |||
| Age, yrs | 69.3±7.84 | ||
| Male, % | 24 (61.5) | ||
| BMI, kg/m2 | 28.9±4.52 | 27.8±4.30 | 0.53 |
| BSA, m2 | 1.8±0.21 | 1.8±0.17 | 0.21 |
| Euroscore II, %a | 0.89 (0.69;1.44) | ||
| Hypertension, % | 33 (84.6) | ||
| Dyslipidemia, % | 28 (71.8) | ||
| Diabetes mellitus, % | 18 (46.2) | ||
| Former smoker, % | 10 (25.6) | ||
| Current smoker, % | 1 (2.6) | ||
| NYHA class III/IV, % | 1 (2.6) | ||
| CAD, % | 18 (46.2) | ||
| Syntax scorea | 0 (0;3) | ||
| CAC scorea | 274.3 (10.5;1632.4) | ||
| Prior PCI, % | 2 (5.1) | ||
| COPD, % | 5 (12.8) | ||
| PAD, % | 1 (2.6) | ||
| Ischemic stroke, % | 0 | ||
| GFR, mL/mina | 101.0 (71.0;113.50) | ||
| Medication | |||
| Statin use, % | 29 (74.4) | 28 (77.8) | 0.73 |
| ACE inhibitor, % | 10 (25.6) | 11 (30.6) | 0.73 |
| ARB, % | 17 (43.6) | 9 (25.0) | 0.04 |
| Aldosterone antagonists, % | 1 (2.6) | 2 (5.6) | 1.00 |
| BB, % | 13 (33.3) | 22 (61.1) | <0.01 |
| Antiplatelet, % | 23 (59.0) | 30 (83.3) | 0.02 |
| Anticoagulant, % | 0 | 13 (33.3) | <0.001 |
Values are mean±SD or count (percentage), where appropriate.
Abbreviations: ACE: angiotensin converting enzyme; ARB: angiotensin receptor blocker; BB: beta-blocker; BMI: body mass index; BSA: body surface area; CAC: coronary artery calcification; CAD: coronary artery disease; COPD: chronic obstructive pulmonary disease; GFR: glomerular filtration rate; NYHA: New York Heart Association; PAD: peripheral arterial disease; PCI: percutaneous coronary intervention.
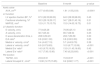
Echocardiographic parameters before and six months after aortic valve replacement.
| Baseline | 6-month | p-value | |
|---|---|---|---|
| Aortic valve | |||
| AVA, cm2a | 0.77 (0.65;0.88) | 1.81 (1.55;2.03) | <0.0001 |
| LV function | |||
| LV ejection fraction BP, %a | 67.0 (62.00;69.00) | 64.0 (59.50;68.00) | 0.45 |
| Fractional shortening, %a | 33.3 (29.16;39.17) | 34.7 (28.01;43.16) | 0.31 |
| MAPSE, mma | 12.9 (11.70;15.70) | 15.9 (14.63;16.75) | 0.01 |
| LV diastolic function | |||
| E velocity, cm/s | 77.9±25.28 | 79.95±25.13 | 0.85 |
| A velocity, cm/s | 92.7±25.44 | 89.7±28.94 | 0.25 |
| E wave deceleration time, s | 208.5±56.23 | 202.7±56.58 | 0.30 |
| E/A ratioa | 0.8 (0.60;1.00) | 0.8 (0.80;0.90) | 0.65 |
| Medial e’ velocity, cm/sa | 5.4 (4.42;7.19) | 5.7 (4.40;6.78) | 0.38 |
| Lateral e’ velocity, cm/sa | 6.9 (5.07;8.83) | 10.0 (8.77;12.08) | <0.001 |
| Medial E/e’ ratioa | 14.5 (9.70;19.20) | 13.9 (11.43;16.83) | 0.43 |
| Lateral E/e’ ratioa | 10.7 (7.95;13.90) | 7.45 (6.23;9.60) | <0.001 |
| RV function | |||
| TAPSE, mm | 23.8±3.91 | 15.9±3.97 | <0.001 |
| Lateral tricuspid S’, cm/sa | 13.90 (12.75;15.85) | 9.2 (8.68;11.77) | <0.001 |
Values are mean±SD.
Abbreviations: BP: biplane; LV: left ventricular; MAPSE: mitral annular plane systolic excursion; RV: right ventricular; TAPSE: tricuspid annular plane systolic excursion.
CMR parameters before and six months after aortic valve replacement.
| Baseline | 6-month | p-value | |
|---|---|---|---|
| LV volume/function | |||
| LV mass, ga | 158.0 (127.25;199.25) | 120.0 (101.00;145.00) | <0.0001 |
| LV mass index, g/m2a | 88.5 (77.00;100.50) | 69.0 (61.00;77.00) | 0.0001 |
| LA area, cm2 | 27.7±5.06 | 25.9±4.32 | 0.03 |
| RA area, cm2 | 20.6±4.82 | 21.8±4.73 | 0.06 |
| LV end-diastolic volume, mLa | 146 (122.00;183.50) | 131.0 (107.00;157.00) | <0.0001 |
| LV end-diastolic volume index, mL/m2a | 82.0 (75.00;96.50) | 73.0 (62.00;82.00) | <0.0001 |
| LV end-systolic volume, mLa | 55.0 (40.50±75.50) | 44.0 (37.00;70.00) | 0.01 |
| LV end-systolic volume index, mL/m2a | 31.0 (23.00;38.00) | 24.0 (21.00;32.00) | 0.01 |
| SV, mLa | 91.0 (82.00;111.50) | 82.0 (69.00;96.00) | <0.01 |
| SV index, mL/m2 | 53.9±11.88 | 46.8±9.74 | <0.01 |
| LVEF, %a | 63.0 (59.00;68.50) | 65.0 (60.00;68.00) | 0.53 |
| CO, mL/min | 6.4±1.65 | 5.4±1.13 | <0.01 |
| CO index, mL/min/m2 | 3.6±0.80 | 3.1±0.62 | <0.01 |
| Abnormal contractility, % | 8 (20.5) | 5 (12.8) | 0.38 |
| Abnormal perfusion, % | 15 (38.5) | 11 (28.2) | 0.34 |
| Abnormal LGE, % | 20 (51.3) | 16 (41.0) | 0.22 |
| Hemodynamic | |||
| SBP, mmHg | 128.5±18.59 | 130.6±14.85 | 0.93 |
| DBP, mmHga | 73.0 (65.25;82.25) | 72.0 (65.00;79.00) | 0.48 |
| Heart rate, bpm | 74.5±11.01 | 75.0±12.74 | 0.57 |
Values are mean±SD.
Abbreviations: AVR: aortic valve replacement; CMR: cardiac magnetic resonance; CO: cardiac output; DBP: diastolic blood pressure; LA: left atrium; LGE: late gadolinium enhancement; LV: left ventricular; LVEF: left ventricular ejection fraction; RA: right atrium; SBP: systolic blood pressure; SV: stroke volume.
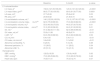
Left ventricular radial, circumferential and longitudinal strain and diastolic velocities before and six months after aortic valve replacement.
| Baseline | 6-month | p-value | |
|---|---|---|---|
| Peak radial strain, % | |||
| Baselinea | 39.2 (28.30;46.71) | 46.8 (30.41;52.87) | 0.12 |
| Midventricular | 27.0±14.46 | 22.5±10.87 | 0.03 |
| Apical | 44.1±17.97 | 37.1±17.71 | 0.04 |
| Global | 36.1±14.89 | 32.4±11.18 | 0.11 |
| Peak circumferential strain, % | |||
| Baseline | -15.1±2.90 | -15.2±2.90 | 0.22 |
| Midventricular | -20.7±4.34 | -18.8±3.36 | 0.01 |
| Apical | -17.1±3.39 | -15.3±3.09 | ˂0.01 |
| Global | -17.8±3.58 | -16.1±2.94 | ˂0.01 |
| Peak longitudinal strain, % | |||
| Baseline | -10.88±3.11 | -11.4±3.02 | 0.46 |
| Midventricular | -21.3±4.31 | -20.6±3.79 | 0.31 |
| Apical | -16.7±4.25 | -15.5±3.57 | 0.07 |
| Globala | -15.60 (-17.54;-13.15) | -13.66 (-16.10;-11.48) | 0.03 |
| Peak radial diastolic velocities, mm/s | |||
| Baseline | -43.8±12.90 | -57.9±16.94 | <0.001 |
| Midventriculara | -37.4 (-42.29;-27.46) | -34.1 (-43.18;-28.52) | 0.41 |
| Apical | -32.8±8.95 | -32.1±9.32 | 0.64 |
| Globala | -33.7 (-39.52;-27.88) | -35.8 (-41.24;-28.82) | 0.59 |
| Peak circumferential diastolic velocities, mm/s | |||
| Baseline | 3.1±4.52 | 7.9±4.75 | <0.001 |
| Midventriculara | 1.2 (-1.27;2.41) | 2.9 (-1.43;3.64) | 0.04 |
| Apicala | 1.3 (-3.75;2.64) | 5.6 (3.75;7.55) | <0.0001 |
| Globala | 1.1 (-1.00;1.50) | -0.8 (-1.99;1.61) | 0.12 |
| Peak longitudinal diastolic velocities, mm/s | |||
| Baselinea | -45.1 (-67.25;-34.43) | -43.6 (-64.32;-32.51) | 0.66 |
| Midventriculara | -45.2 (-61.79;-34.15) | -45.9 (-64.21;-37.11) | 0.93 |
| Apicala | -23.0 (-35.86;-13.82) | -20.9 (-32.19;-14.39) | 0.47 |
| Globala | -37.0 (-55.82;-28.02) | -34.4 (-51.70;-27.41) | 0.69 |
Values are mean±SD.
Abbreviations: LV: left ventricular.
At six-month follow-up, we observed significant reductions in LVM (p<0.0001), CO (p<0.01), LVEDV (p<0.0001), LVESV (p=0.01) and SV (p<0.01) (Table 4), as well as in respective indexes and left atrium (LA) area. However, no statistically significant differences were found between LVEF pre- and postintervention.
Diastolic function remodeling after aortic valve replacementDiastolic velocities assessed by CMR, baseline peak radial diastolic velocity, and baseline, mid, and apical, peak circumferential diastolic velocities increased six months after intervention, when compared to preoperative values (Table 5). Accordingly, diastolic function assessed by lateral e’ velocity (p<0.001) and lateral E/e’ ratio (p<0.001) also improved post-AVR (Table 3). However, there was no evidence of change in longitudinal diastolic velocities in any segment as assessed by CMR.
Systolic function remodeling after aortic valve replacementWe found a significant decrease in mid and apical radial strain, in mid, apical, and global circumferential strain, and in GLS, six months after intervention (Table 5). Figure 3 depicts differences in GRS, GCS, GLS and LVEF measurements from baseline to six months following AVR. Even though we cannot assure statistical significance in all the following individual variations, for descriptive terms of general postoperative strain behavior considering baseline measurements, we detected variations (both increase and decrease) beyond intra-observer variability in GCS in six and 17 patients and in GLS measurements in four and 16 patients, respectively, six months after intervention. In those patients whose GLS or GCS increased, preoperative measurements were reduced. If we consider the median values in our population, six and three patients whose GCS and GLS increased beyond intra-observer variability had baseline values lower than the median, respectively. LVEF remained unchanged. RV systolic function assessed by tricuspid annular plane systolic excursion (TAPSE) and RV S wave velocity also decreased significantly and became impaired following intervention, according to the normal range reported in the literature.29

Systolic function remodeling - evolution of global radial, circumferential and longitudinal strain and left ventricular ejection fraction measurements from baseline to six months following aortic valve replacement.
LVEF: left ventricular ejection fraction; GCS: global circumferential strain; GLS: global longitudinal strain; GRS: global radial strain.
*GCS and GLS were significantly reduced after intervention.
In patients whose GLS decreased following AVR, comparing to those that did not, we found lower measurements of LVEDV, indexed for body surface area (LVEDVi) both before, 78.8±10.69 mL/m2 vs 94.3±31.41 mL/m2, p=0.04, and after intervention, 67.4±11.78 mL/m2 vs 79.1±16.57 mL/m2, p=0.01, respectively. SV indexed for body surface area (SVi), 6 months after intervention, was also significantly different between patients whose GLS decreased after intervention (41.9±9.18 mL/m2) and those that did not (50.2±8.79 mL/m2), p<0.01.
In order to better understand GLS postoperative remodeling, we then built a multiple linear regression model including age, gender, baseline GLS, LVM, AVA and LVESV; our model was able to explain 49.0% of variation in GLS difference between pre- and postoperative measurements (Table 6).
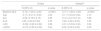
Simple and multiple linear regression for the determinants of global longitudinal strain difference post-aortic valve replacement.
| Simple | Multiplea | |||
|---|---|---|---|---|
| B (95% CI) | p-value | B (95% CI) | p-value | |
| Baseline GLS | -0.72 (-1.03 to -0.40) | <0.0001 | -0.71 (-1.02 to -0.40) | <0.0001 |
| Age | -0.17 (-0.31 to -0.02) | 0.02 | -0.11 (-0.23 to 0.02) | 0.10 |
| Sex | -0.28 (-2.75 to 2.19) | 0.82 | -0.12 (-2.47 to 2.14) | 0.88 |
| AVA | 2.60 (-4.30 to 9.50) | 0.45 | 1.84 (-4.32 to 8.00) | 0.55 |
| LVM | -0.002 (-0.02 to 0.02) | 0.86 | -0.01 (-0.03 to 0.02) | 0.54 |
| LVESV | -0.013 (-0.05 to 0.02) | 0.44 | 0.02 (-0.02 to 0.06) | 0.29 |
Abbreviations: AVA: aortic valve area; CI: confidence interval; GLS: global longitudinal strain; LVESV: left ventricular end systolic volume; LVM: left ventricular mass.
Analyzing our simple linear regression model, where difference between GLS postoperative and preoperative measurements represents the dependent variable, and baseline GLS is the independent variable, we were able to find that improvement in postoperative measurements was more likely to be achieved if GLS baseline value was impaired below -13%.
We also further analyzed our multiple linear regression model, and concluded that postoperative improvement could potentially be predicted if GLS-0.235·LVESV<-15.0. The same conclusion can be applied if GLS-6.20·AVA<-17.9. We used both baseline LVESV and AVA as these were the parameters which most influenced difference between post- and preoperative GLS measurements, according to our linear regression model.
DiscussionIn this study, we found that baseline GCS and GLS values were reduced in more than half of patients, despite normal LVEF. After intervention, reverse remodeling was paralleled by improvement in diastolic function, worse RV systolic function, and reduction in GLS and GCS, while LVEF and GRS remained unchanged. We also found that the variation in GLS difference between postoperative and preoperative measurements could be explained by 49.0% in our multiple model, where baseline GLS is an independent predictor, regardless of age, gender, AVA, LVM and LVESV.
Baseline strain impairment with preserved left ventricular ejection fractionCurrent literature describes impaired preoperative strain values despite normal LVEF. This may represent LV dysfunction not identified by LVEF assessment.2,12–14 Accordingly, our results show impaired baseline strain in a considerable proportion of patients, despite preserved LVEF. In LVEF impairment, ventricular remodeling might be irreversible after intervention. Hence, LVEF may not be an adequate parameter to identify early systolic dysfunction, which could support the decision for successful surgery, namely in asymptomatic patients. Although strain has been considered superior to LVEF in detecting systolic dysfunction in AS patients, probably rendering it an important factor in the best timing to decide upon intervention, its behavior following this procedure is not yet fully established.
Strain change after intervention and contributing factorsIn earlier stages of the disease, GLS can be impaired, despite normal or supranormal GCS that compensates for longitudinal dysfunction, enabling preserved LVEF.16 However, we found both reduced baseline GLS and GCS in our population, suggesting that compensating mechanisms might have already been compromised preoperatively, which was unapparent in LVEF assessment. Accordingly, patients with baseline reduced GCS had lower LVEF measurements. Although some studies reported an echocardiographic improvement of GLS and GCS following AVR in severe AS patients with preserved LVEF,13,16,18 Nucifora et al. demonstrated that CMR-assessed GLS significantly worsened in patients soon after SAVR, but showed improvement 15 months after intervention.23 No significant change in baseline or mid-LV circumferential strain as well as a significant decline in peak apical circumferential strain six months following AVR were demonstrated.22 In our study, GLS and GCS significantly decreased six months after intervention, which may represent impaired longitudinal and circumferential myocardial deformation, and hence a mild worsening of systolic function. These results may seem partially contradictory given the improvement observed and previously documented by other authors in structural and diastolic functional parameters,30 and to the intuitive expectation of strain improvement following intervention. However, SAVR is an invasive and aggressive procedure. In fact, aortic cross clamping-related ischemia and reperfusion injury, together with systemic activation of inflammatory response due to the surgical approach, can lead to early systolic function impairment, and time for recovery is not yet fully established.31,32 In our study, patients whose GLS decreased after intervention did not have baseline LV dilation. Dilation of the LV already results in some impairment of the initial compensatory mechanisms and may be associated with a higher potential for recovery following the pressure-relief intervention. In non-dilated LV, lower initial benefits might be expected from AVR, with the initial inflammatory aggression potentially dominating the postoperative period, which may translate into the observed early systolic function decrease.
Analysis of our patients also showed impairment of RV systolic function, further supporting a potential worsening in systolic function six months after intervention, as our strain analysis suggested. However, despite early strain reduction, we hypothesize that a longer follow-up period would likely show strain improvement, following the observed favorable structural remodeling and diastolic function improvement at the ventricular level, which represents a reversal in disease progression.
Our population of severe AS patients had an AVA of <1 cm2, which may lead to reduced coronary flow reserve and therefore myocardial ischemia,33 increasing perimyocytic fibrosis.34 In fact, in addition to LV hypertrophy due to increased afterload, which may impair intraventricular pressure gradients (possibly reflecting ventricular dysfunction),35,36 AS also leads to myocardial fibrosis and potentially longitudinal systolic dysfunction.37 Moreover, it has been demonstrated that patients with severe myocardial fibrosis have impaired longitudinal strain and to affect postoperative remodeling and outcomes. Thus, it has been proposed that GLS may also be used as a noninvasive marker reflecting myocardial fibrosis,38 therefore establishing a link to poorer outcomes, when impaired.37 As 51.3% of our patients had baseline localized fibrosis assessed by LGE, which did not change significantly after AVR, we may infer that fibrosis might have influenced the low GLS and GCS baseline measurements. Besides, even though aortic valve intervention determined a relief in pressure overload, the presence of irreversible fibrosis may have contributed to persistent LV decompensation and non-improvement of GLS and GCS following intervention. Considering that diffuse fibrosis (but not midwall replacement fibrosis) has been suggested to be reversible after AVR,20,39 we speculate that postoperative GLS would probably have evolved more favorably if the intervention had preceded LV replacement fibrosis (possibly represented by a lesser degree of preoperative strain impairment).
As described above, LV strain is influenced by ventricular structural parameters. However, our multiple regression model suggests that half of the variation in postoperative GLS difference might be explained by baseline GLS measurements, even if adjusted for age, gender, and AVA, but also baseline LVM and LVESV. This model suggests that postoperative strain measurements, likely translating systolic function evolution, depend on baseline GLS measurements, further supporting the importance of considering baseline GLS in decision-making to optimize outcomes after intervention. The analysis of the simple linear model which had preoperative GLS as the independent variable suggested that baseline GLS under -13% would likely translate into a beneficial difference regarding postoperative GLS measurements. Regarding this, our contribution may be particularly relevant to identify those patients who might benefit the most from earlier valve intervention to foster LV reverse remodeling. Hence, it shows potential to be incorporated in heart team discussion of early intervention in severe AS patients with preserved LVEF and to be implemented in future guideline recommendations for this population.
LV reverse remodelingRegarding reverse remodeling following AVR in patients with AS, a decrease in LVM and LV volume (LVV) is usually observed, along with an increase in SV, CO and LVEF over time,39–41 even though persistent LV hypertrophy after surgery may occur and is associated with worse prognosis.42 We found a decrease in LVM and LVV six months after intervention, resulting in a reduced mass-to-volume ratio (when compared to baseline values), which may be explained by proportionally smaller LVM relative to LVV, meaning less LV strength to eject blood, along with a decrease in SV (and consequently in CO), while LVEF remained unchanged. We should also take into account that after intervention, the use of ARBs was significantly reduced, while the use of beta-blocker (BB) increased significantly. ARB have been identified as delaying cardiac remodeling. However, BBs not only seem to contribute to reduce LVV, but also have a negative chronotropic effect, lowering heart rate, and consequently, cardiac output.43 Taken together with reduced LV strain postoperative measurements, we infer limited LV deformability, which may also have contributed to the decrease in SV, and consequently CO. Hence, even though structure parameters evolved favorably (LVM and LVV reduction six months after intervention), a larger time interval may be warranted to observe its benefits in systolic function, which may be evident by CMR strain analysis.
LimitationsWe acknowledge several limitations of this work. First, we included a relatively small and heterogenous population, with various comorbidities that may impact strain change and mask the physiological mechanisms behind strain behavior after AVR.44 However, we intended to pragmatically reproduce the clinical practice reality in a very well characterized population studied with advanced imaging (repeated CMR) to detect small changes in strain and EF after AVR. Besides, LV strain assessment does not allow blinding regarding preoperative or postoperative stage of the patients. Moreover, strain analysis is affected by afterload (which is reduced following AVR), usually neglected when assessing this imaging parameter, which only considers myocardial deformation.8 Consequently, strain increase or decrease may not represent direct systolic function improvement or impairment respectively, requiring the integration of multiple factors when interpreting its significance in clinical practice. Furthermore, strain values vary among operator, methods, modalities, and software, and further standardization is needed before being considered in clinical decisions. Hence, our study would have benefited of a control paired population in order to compare and validate the obtained results. Moreover, we lacked CMR techniques allowing T1 mapping and extracellular volume (ECV) quantification, parameters of great benefit in diagnostic, therapeutic and prognostic clinical decision, which could have contributed to enrich our study.45 Finally, a longer follow-up, with repeated assessments, could potentially have allowed identification of the best timing to detect strain improvement in AS patients after AVR, likely representing the time necessary for systolic function recovery.
ConclusionsStrain identifies LV systolic dysfunction earlier than LVEF in AS patients and may have a potential role in identifying patients at early stages of the disease who would most likely benefit from surgical intervention. This may be particularly relevant in asymptomatic patients with preserved LVEF, who currently have no indication for AVR. Soon after AVR, LV reverse remodeling may be paralleled by diastolic function improvement, but also by GLS and GCS reduction, potentially suggesting systolic function impairment, while LVEF remains unchanged. The clinical utility and timing of assessment of postoperative strain changes as a marker of systolic function evolution needs further research.
ClinicalTrials.gov registrationNCT03280433.
Competing interestsThe authors have declared no competing interests.
FundingMancio J was supported by the Fundação Portuguesa para a Ciência e Tecnologia (SFRH/BD/104369/2014) and by the Sociedade Portuguesa de Cardiologia (“Bolsa de investigação João Porto”). This paper is a result of the project DOCnet (NORTE-01-0145-FEDER-000003), supported by Norte Portugal Regional Operational Program (NORTE 2020), under the PORTUGAL 2020 Partnership Agreement, through the European Regional Development Fund (ERDF).
Conflicts of interestThe authors have no conflicts of interest to declare.
