


Complex risk scores have limited applicability in the assessment of patients with myocardial infarction (MI). In this work, the authors aimed to develop a simple to use clinical score to stratify the in-hospital mortality risk of patients with MI at first medical contact.
MethodsIn this single-center prospective registry assessing 1504 consecutively admitted patients with MI, the strongest predictors of in-hospital mortality were selected through multivariate logistic regression. The KAsH score was developed according to the following formula: KAsH=(Killip class×Age×Heart rate)/systolic blood pressure. Its predictive power was compared to previously validated scores using the DeLong test. The score was categorized and further compared to the Killip classification.
ResultsThe KAsH score displayed excellent predictive power for in-hospital mortality, superior to other well-validated risk scores (AUC: KAsH 0.861 vs. GRACE 0.773, p<0.001) and robust in subgroup analysis. KAsH maintained its predictive capacity after adjustment for multiple confounding factors such as diabetes, heart failure, mechanical complications and bleeding (OR 1.004, 95% CI 1.001-1.008, p=0.012) and reclassified 81.5% of patients into a better risk category compared to the Killip classification.
KAsH's categorization displayed excellent mortality discrimination (KAsH 1: 1.0%, KAsH 2: 8.1%, KAsH 3: 20.4%, KAsH 4: 55.2%) and better mortality prediction than the Killip classification (AUC: KAsH 0.839 vs. Killip 0.775, p<0.0001).
ConclusionKAsH, an easy to use score calculated at first medical contact with patients with MI, displays better predictive power for in-hospital mortality than existing scores.
A complexidade de scores de risco limita a sua aplicabilidade na avaliação inicial do doente com enfarte agudo do miocárdio (EAM). Pretende-se desenvolver um score clínico simples para estratificação do risco de mortalidade hospitalar na avaliação imediata destes doentes.
MétodosEstudo prospetivo, unicêntrico, com avaliação de 1504 doentes consecutivos admitidos com EAM. Regressão logística multivariada selecionou as variáveis clínicas com maior capacidade preditiva de mortalidade hospitalar. O score foi desenvolvido de acordo com a seguinte fórmula: KAsH=(Classe Killip-Kimball×Idade×Frequência Cardíaca)/Pressão Arterial Sistólica. A sua capacidade preditiva foi comparada pelo teste De Long com outros scores previamente validados. O score foi categorizado e comparado com a classificação de Killip-Kimbal.
ResultadosO KAsH apresentou uma excelente capacidade preditiva de mortalidade hospitalar, superior à dos outros scores avaliados (AUC: KAsH 0,861 vs. GRACE 0,773, p<0,001), robusto na análise de subgrupos. O score manteve capacidade de predição independente da presença de vários fatores de confundimento, como diabetes tipo dois, insuficiência cardíaca, complicações mecânicas ou hemorrágicas, entre outros (OR 1,004, IC 1,002-1,008, p=0,012) e reclassificou 81,5% dos doentes para um melhor estrato de risco comparativamente à classe de Killip-Kimbal. A categorização apresenta uma excelente discriminação da mortalidade (K1 – 1,0%, K2 – 8,1%, K3 – 20,4%, K4 – 55,2%) e um incremento significativo face à classificação de Killip-Kimbal (AUC: KAsH 0,839 versus Killip 0,775, p<0,0001).
ConclusãoO KAsH, rapidamente calculado na avaliação primária do doente com EAM, revela melhor capacidade preditiva e discriminativa de mortalidade hospitalar do que os scores existentes.
In 1967, when Thomas Killip and John Kimball detailed their experience of a coronary unit, they introduced a simple classification of acute heart failure in myocardial infarction (MI).1 The Killip classification quickly became the standard bedside tool for assessing patients with MI due to its good discriminative power and especially to its simple and intuitive design.2
Risk stratification is an integral part of the assessment of patients with MI. It enables the physician to better characterize the patient and tailor a suitable short- and long-term treatment strategy.3–6 Prognostic scoring systems were developed to reduce the complexity of MI patients to a single number or measure of survival probability.7–20 They complement clinical gestalt, standardize risk estimation and enable risk stratification for research purposes. However, to properly use a risk score, it is necessary to first understand the details of their formulation, their strengths and shortcomings.
GUSTO,21 TIMI,8,14 PURSUIT7 and the Simple Risk Index (SRI)9 are older scores derived from various medical trials that under-represented high-risk patients and applied therapeutic strategies that no longer reflect current practice.
The GRACE score11 was derived from the Global Registry of Acute Coronary Events. It is one of the most robust algorithms for predicting both short- and long-term outcomes.10,22 It has since been upgraded23 and simplified,12 and is generally used in clinical practice to assess patients with non-ST-elevation acute coronary syndromes.4,24 It is, however, a complex and time-consuming score, requiring both clinical and laboratory variables that are unavailable at first medical contact.
ProACS13 and C-ACS19 are simple four-variable scores that have recently been developed to enable risk stratification at first medical contact. However, they are both calculated by pre-categorizing continuous variables, requiring increased memorization for each variable and reducing the model's discriminative capacity.25–27
There is no continuous score for predicting in-hospital mortality in patients with MI that has been created and validated in a contemporary population.
In this work the authors aimed to develop a simple but powerful risk score, designed to be used at first medical contact to predict in-hospital mortality of patients with MI.
MethodsData collection and managementCOLGE is a single-center prospective registry of consecutively admitted patients with acute coronary syndrome (ACS). All patients with MI were included. MI was defined according to the third universal definition of type 1 MI.28
Data were collected by cardiology residents and specialists via an application embedded in the ATRIUM software of the Madeira Regional Health Authority and are subject to the data protection regulations of the regional healthcare system. Patients’ demographic, clinical management and clinical outcome data were collected. Previous diagnoses were defined, if known, according to specific medication or to the most recent European guidelines at the time of data collection. Patient names were hidden during data management. Therapeutic decisions were left to the attending physician and site-specific protocols.
This manuscript was written in accordance with the TRIPOD checklist29 and the study complies with the 1975 declaration of Helsinki.30
EndpointsThe primary endpoint was all-cause mortality during the index hospitalization. The secondary endpoint was cardiovascular mortality during the index hospitalization.
DefinitionsCardiovascular mortality was defined as death due to the immediate consequences of MI, such as progressive heart failure, mechanical complications or malignant arrhythmias, or death due to complications during coronary procedures to treat myocardial ischemia.
Angioplasty was defined as balloon angioplasty with or without stent deployment.
Bleeding was defined as any sign or symptom of bleeding that requires medical intervention, leads to prolonged hospitalization or increased level of care, requires adjustment of anticoagulation or antiplatelet therapy, leads to a fall in hemoglobin ≥2.0 g/dl, requires transfusion of whole blood or red cells, is located in a critical area or organ (intracranial, intraspinal, intraocular, retroperitoneal, intra-articular or intramuscular with compartment syndrome), or is fatal.
PredictorsClinical variables available at first medical contact were assessed as predictors of the primary endpoint. Only the first recorded value was counted for continuous variables. A history of clinical conditions such as diabetes or hypertension was not included since they are not measurable and may not be available at first medical contact. Patients with missing data in any of these variables were excluded from the analysis.
Statistical analysisA minimum sample of 385 participants was calculated to be required for a 5% margin of error with 95% confidence level (CI).
Categorical variables were presented as percentages and compared using the chi-square test. Continuous variables were tested for normality with the Kolmogorov-Smirnov test. Those that displayed a normal distribution were presented as means and standard deviation and compared using analysis of variance. Continuous variables without normal distribution were presented as medians and interquartile range and compared with the Kruskal-Wallis test.
Associations of the selected predictor variables with the primary endpoint were first tested using any of the above-mentioned tests. Variables associated with in-hospital mortality were further assessed using multivariate backward Wald logistic regression, isolating the strongest predictors of the primary endpoint. Using a simple multiplicative model, the selected variables were placed as numerator or denominator according to their direct or indirect relationship with the primary endpoint, respectively.
The model's robustness was assessed in multivariate enter logistic regression, adjusted to other confounding variables associated with in-hospital mortality that were not available at patient admission or not selected in the first regression.
The model's predictive power was assessed using receiver operating characteristic (ROC) curves and the respective area under the curve (AUC). The model was compared with other validated risk scores (GRACE, TIMI, PURSUIT, SRI, EMMACE, CHA2DS2-VASc-HS and ProACS). ROC curves were compared using the DeLong test.31
The model was then categorized into four subgroups using IBM SPSS® Statistics Optimal Binning, further adapted by the authors to increase the clinical utility of the resulting subgroups. The predictive power of the categorized model was compared with the classic Killip classification on admission. Patient reclassification was assessed using continuous net reclassification improvement (cNRI).
Statistical analyses were performed in IBM SPSS Statistics® version 23.0.0.0. ROC curve analysis and the DeLong test were performed in MedCalc® version 14.8.1 and cNRI was developed in R software, version 1.0.136, using the PredictABEL package.32 All statistical tests were two-sided with a cut-off value of 0.05 for significance.
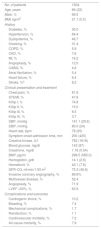
ResultsParticipantsA total of 1783 patients were consecutively admitted for ACS between October 2009 and September 2016. Patients with unstable angina (n=210) and patients with missing data in the variables available on admission (n=69) were excluded (Figure 1), resulting in a population of 1504 patients consecutively admitted for MI (Table 1). This sample size provides a margin of error of 2.53% with 95% CI.

Characteristics of the study population.
| No. of patients | 1504 |
| Age, years | 66 (22) |
| Male, % | 69.5 |
| BMI, kg/m2 | 21.1 (5.5) |
| History | |
| Diabetes, % | 30.0 |
| Hypertension, % | 64.4 |
| Dyslipidemia, % | 46.7 |
| Smoking, % | 31.4 |
| COPD, % | 5.9 |
| CKD, % | 7.6 |
| MI, % | 16.2 |
| Angioplasty, % | 12.0 |
| CABG, % | 4.6 |
| Atrial fibrillation, % | 5.4 |
| Heart failure, % | 6.4 |
| Stroke, %a | 8.2 |
| Clinical presentation and treatment | |
| Chest pain, % | 81.6 |
| STEMI, % | 47.8 |
| Killip I, % | 74.8 |
| Killip II, % | 15.0 |
| Killip III, % | 6.5 |
| Killip IV, % | 3.7 |
| SBP, mmHg | 141.1 (29.6) |
| DBP, mmHg | 80.0 (24) |
| Heart rate, bpm | 78 (25) |
| Symptom onset-admission time, min | 200 (425) |
| Creatine kinase, U/l | 762 (1618) |
| Blood glucose, mg/dl | 143 (87) |
| Creatinine, mg/dl | 1.18 (0.54) |
| BNP, pg/ml | 298.5 (585.0) |
| Hemoglobin, g/dl | 14.1 (2.6) |
| Hematocrit, % | 42.1 (7.6) |
| GFR-CG, ml/min/1.93 m2 | 75.3 (46.8) |
| Invasive coronary angiography, % | 89.6% |
| Multivessel disease, % | 52.4 |
| Angioplasty, % | 71.9 |
| LVEF >50%, % | 63.9 |
| Complications and outcomes | |
| Cardiogenic shock, % | 10.2 |
| Bleeding, % | 7.4 |
| Mechanical complications, % | 1.7 |
| Reinfarction, % | 1.1 |
| Cardiovascular mortality, % | 7.2 |
| All-cause mortality, % | 7.9 |
BMI: body mass index; BNP: brain natriuretic peptide; CABG: coronary artery bypass grafting; CKD: chronic kidney disease; COPD: chronic obstructive pulmonary disease; DBP: diastolic blood pressure; GFR-CG: glomerular filtration rate estimated by the Cockcroft-Gault formula; LVEF: left ventricular ejection fraction; MI: myocardial infarction; SBP: systolic blood pressure; STEMI: ST-elevation myocardial infarction.
The clinical variables available at first medical contact were isolated and their associations with in-hospital mortality were tested (Supplementary Table 1). Variables with a statistically significant association with mortality were age, gender, chest pain, Killip classification at admission, systolic and diastolic blood pressure and heart rate at admission.
The isolated variables were studied in a multivariate backward Wald logistic regression model. The regression model correctly predicted 92.8% of the primary endpoint events. The most robust variables were Killip class on admission, age, systolic blood pressure and heart rate (Table 2).
Multivariate backward Wald logistic regression for in-hospital mortality.
| B | OR | 95% CI | p | |
|---|---|---|---|---|
| Age | 0.054 | 1.056 | 1.036-1.076 | <0.001 |
| Male gender | -0.155 | 0.856 | 0.538-1.363 | 0.513 |
| Chest pain | -0.044 | 0.957 | 0.591-1.551 | 0.859 |
| Killip class | 0.786 | 2.194 | 1.775-2.711 | <0.001 |
| SBP | -0.024 | 0.977 | 0.969-0.984 | <0.001 |
| DBP | 0.004 | 1.004 | 0.987-1.022 | 0.636 |
| Heart rate | 0.014 | 1.014 | 1.006-1.022 | 0.001 |
| Estimated probability of death=exp−5.717+0.786×K+0.054×Age−0.024×SBP+0.014×HR1+exp−5.717+0.786×K+0.054×Age−0.024×SBP+0.014×HR | ||||
Goodness of fit: Hosmer-Lemeshow test=9.172, 8 degrees of freedom, p=0.328. Constant B=-5.717±0.915. No. of iterations=4.
CI: confidence interval; DBP: diastolic blood pressure; HR: heart rate; K: Killip class; OR: odds ratio; SBP: systolic blood pressure.
Using a basic multiplicative structure, the four selected variables were placed as numerator or denominator depending whether their odds ratio for mortality was above or below 1.0, respectively. The score was named KAsH, after the initials of each variable and their position as numerator or denominator.
Performance of the KAsH scoreIn ROC curve analysis, KAsH demonstrated excellent predictive power for in-hospital mortality, with an AUC of 0.861, 89% sensitivity and 70% specificity (Supplementary Figure 1).
KAsH displayed excellent robustness, maintaining predictive power even after adjustment for confounding variables including gender, diabetes, previous MI, heart failure or chronic kidney disease, no chest pain on admission, any clinically significant bleeding, cardiogenic shock, mechanical complications, no invasive coronary angiography and STEMI (odds ratio 1.004; 95% CI 1.001-1.008; p=0.012) (Supplementary Table 3).
Addition of the continuous variables of age, systolic blood pressure and heart rate to Killip class significantly improved classification: 81.5% of patients were classified into a better risk stratum with all four variables compared to the Killip classification alone (Table 3).
Reclassification analysis with continuous net reclassification improvement.
| Events (n) | 119 | |
| Non-events (n) | 1385 | |
| cNRI, % | p | |
| cNRI events | 29.4 (12.2-46.6) | 0.0008 |
| cNRI non-events | 52.1 (47.6-56.6) | <0.0001 |
| cNRI | 81.5 (63.7-99.2) | <0.0001 |
| IDI statistics | 0.025 (0.019-0.031) | <0.0001 |
cNRI: continuous net reclassification improvement; IDI: integrated discrimination improvement.
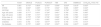
Compared with previously validated scores, KAsH displayed the highest predictive power for both all-cause and cardiovascular mortality (Figure 2). In the subgroup analysis, KAsH showed excellent consistency, being the highest-rated score in the majority of subgroups for both primary and secondary endpoints (Table 4 and Supplementary Table 4).
 and cardiovascular (B) mortality.")
Comparison of areas under the receiver operating characteristic curve for all-cause mortality.
| KAsH | GRACE | ProACS | PURSUIT | TIMI | SRI | EMMACE | CHA2DS2-VASc-HS | |
|---|---|---|---|---|---|---|---|---|
| MI | 0.861 | 0.773c | 0.804c | 0.757c | 0.549c | 0.819b | 0.813b | 0.643c |
| STEMI | 0.895 | 0.803c | 0.845c | 0.775c | 0.524c | 0.866 | 0.855a | 0.643c |
| NSTEMI | 0.818 | 0.791 | 0.759a | 0.743a | 0.626c | 0.759a | 0.760a | 0.682b |
| Age ≤65 years | 0.858 | 0.717a | 0.819 | 0.724a | 0.461c | 0.780 | 0.784 | 0.565c |
| Age >65 years | 0.809 | 0.706c | 0.731c | 0.672c | 0.444c | 0.769 | 0.769 | 0.524c |
| Killip class ≤II | 0.838 | 0.770b | 0.752c | 0.738c | 0.566c | 0.806 | 0.798a | 0.665c |
| Killip class >II | 0.770 | 0.637a | 0.761 | 0.583c | 0.453c | 0.718a | 0.750 | 0.493c |
| Diabetes | 0.810 | 0.755 | 0.767 | 0.677b | 0.574c | 0.746 | 0.775 | 0.613c |
| No diabetes | 0.876 | 0.775c | 0.820c | 0.793b | 0.507c | 0.852 | 0.831b | 0.628c |
Results of the comparison of KAsH with each score by the DeLong test are marked as ap<0.05, bp<0.01, cp<0.001, other values p>0.05.
MI: myocardial infarction; NSTEMI: non-ST-elevation myocardial infarction; STEMI: ST-elevation myocardial infarction.
Using cut-offs derived from the IBM SPSS® Optimal Binning protocol, KAsH was categorized into four risk groups. The cut-offs were adjusted for natural numbers (multiples of ten), both for greater simplicity and to adequately discriminate four clinically relevant patient subgroups. The groups displayed excellent mortality discrimination (Table 5).
KAsH categorization and comparison with Killip class.
After categorization, KAsH retained very good predictive power for in-hospital all-cause and cardiovascular mortality (AUC 0.839 and 0.834, respectively). It displayed a highly significant improvement in predictive power compared to the Killip classification alone (AUC 0.775, p<0.0001) (Supplementary Figure 2).
DiscussionDespite the development of new invasive and pharmaceutical therapies, ischemic heart disease remains the leading cause of death worldwide.33 Patients with MI are a heterogeneous population in terms of both clinical history and severity of presentation. Early risk assessment enables the physician to tailor appropriate invasive and pharmacological therapies, plan the duration of stay in intensive care units or define the long-term treatment strategy.3–6,34
Scores have long been an important tool in risk assessment, complementing the physician's insight and standardizing risk assessment. Multiple risk scores have been validated to assess the different possible presentations of ischemic heart disease.7–20 However, the use of these risk scores has some disadvantages. First, scores like PURSUIT, TIMI, GUSTO and SRI were created using the populations of clinical trials that were subject to inclusion and exclusion criteria and hence do not fully represent real-life populations. Second, older scores were validated using patients who had not received contemporary medical and invasive treatment; and finally, more robust scores, like GRACE, are very complex to use and memorize and require variables unavailable at first medical contact.
Recently, other scores have been developed to enable risk stratification at first medical contact.13,19 ProACS and C-ACS were generated from large national ACS registries and displayed robust predictive power. They are both based on four variables, unsurprisingly similar to KAsH's, and are calculated by pre-categorizing each variable into subgroups and by scoring the strata of each variable. However, the pre-categorization of variables not only adds to the burden of memorization for every variable, but also significantly reduces the model's discriminative capacity and creates a residual confounding bias.25–27
KAsH is the first continuous multiplicative score able to predict in-hospital mortality in patients with MI that was developed to be used at first medical contact and validated in a real-life contemporary population. The score is named after the initials of each of its four variables (Killip, Age, systolic blood pressure and Heart rate), organized in a simple, easy to memorize multiplicative model.
KAsH displayed excellent predictive power for both all-cause (AUC=0.861) and cardiovascular (AUC=0.858) mortality, significantly higher than the GRACE score for both endpoints. Its predictive power was maintained despite adjustment for several important confounding factors including bleeding, mechanical complications, STEMI and the development of cardiogenic shock.
By avoiding pre-categorization, KAsH includes the full range of values of each variable, enabling it to be applied as a true continuous score. cNRI was used to determine the effect of adding continuous clinical variables to the classic categorical Killip assessment. It demonstrated a higher risk estimation in 30% of patients with hospital mortality, and a lower risk estimation in half of patients with in-hospital survival, than the Killip classification alone (cNRI events=29.4%; cNRI non-events=52.1%). These simple variables, assessed at first medical contact, enabled risk estimation to be improved in 81.5% of patients with MI (cNRI=81.5%).
In contrast to what was observed with other risk scores, KAsH displayed excellent consistency, being persistently the highest rated score in the majority of subgroups, making it a well-rounded, versatile score for all MI patients.
Categorizing KAsH was an important step to improve its ease of use in a real-life setting. KAsH's categorization was not based on quantile division, since this would not have reflected the nature of the population,35 but rather by means of an automatic categorization protocol that is statistically ideal for mortality prediction. The cut-offs were adjusted using clinical input from the authors to simplify use and memorization, and so that each KAsH group corresponded to clinically relevant risk group: KAsH 1 (<40) – low risk; KAsH 2 (40-90) – intermediate risk; KAsH 3 (90-190) – high risk; KAsH 4 (>190) – very high risk. Categorizing KAsH reclassifies more than half of the population as low risk, with a mortality of ∼1%, and conveys a more clearly defined risk burden to each risk strata. In the Killip classification, classes II and III offer similar information regarding patient risk. This may be justified due to the inherently subjective burden of the Killip classification observed in the transition between acute heart failure and acute pulmonary edema. Furthermore, even after categorization, KAsH retains excellent predictive ability (AUC 0.831), significantly higher than the Killip classification (AUC 0.775).
LimitationsFirstly, although COLGE is a prospective continuous registry, some patients were excluded due to missing data. However, they were only a small proportion of the overall population (n=4.3%), and this is unlikely to have significantly changed the analysis.
Secondly, KAsH was created based on the experience of a single center, and thus requires further external validation in other populations.
ConclusionThe KAsH risk score is simple to use and memorize for application at first medical contact to predict hospital mortality in patients with MI. It displays better predictive power and consistency than other well-validated risk scores and offers a significant increase in risk prediction precision compared to the Killip classification. When categorized into four subgroups it retains its excellent predictive power and mortality risk discrimination. External validation will enable its widespread clinical use.
Conflicts of interestThe authors have no conflicts of interest to declare.
The following are the supplementary material to this article:

