

Pregnancy can affect the cardiac conduction system, causing changes to the electrocardiographic indices that may mimic pathologic ones. The aim of this study was to discover these changes in normal pregnant women.
MethodsWe included 103 healthy pregnant women, aged between 18-35 years. Standard 12-lead electrocardiogram was performed in the first and third trimester and electrocardiographic indices were calculated. The patients were classified in two age categories.
ResultsThe mean PR interval in trimester one (T1) was 133.36±20.9 ms and in third trimester (T3) was 125.03±22.6ms (p=0.046). The mean QT in T1 and T3 was 314.21±18.99 ms and 324.02±19.4 ms, respectively (p<0.001). QRS duration in T1 and T3 was 90.24±28.91 ms and 94.97±10.79 ms, respectively (p=0.027). Mean of QTc (corrected QT interval) was 384.03±23.2 in T1 and 393.20±42.48 ms in T3 (p 0.023). The difference in electrocardiogram indices between T1 and T3 was not significant within the two age groups.
ConclusionWhen comparing results between T1 and T3, mean parameters of electrocardiogram indices showed significant statistical differences. This will contribute insight on the approach to a number of pregnant women who complain of palpitations and visit a cardiologist. Although not statistically significant, the QT dispersion was 2% higher in participants over 30 years of age.
A gravidez pode afetar o sistema de condução cardíaca, causando alterações nos índices eletrocardiográficos que podem simular índices patológicos. O objetivo deste estudo consistiu em descobrir as alterações mencionadas em grávidas normais.
MétodosIncluímos 103 grávidas saudáveis, entre 18 e 35 anos. Foi efetuado um eletrocardiograma padrão de 12 derivações no primeiro e no terceiro trimestres e foram calculados os índices eletrocardiográficos. As doentes foram classificadas em duas categorias etárias.
ResultadosO intervalo PR médio no trimestre um (T1) foi de 133,36±20,9 milissegundos (ms) e no trimestre três (T3) foi de 125,03±22,6ms (p=0,046). O QT médio no T1 e no T3 foi de 314,21±18.99 ms e de 324,02±19,4 ms, respetivamente (p<0,001). A duração do QRS no T1 e no T3 foi de 90,24±28,91ms e de 94,97±10,79 ms, respetivamente (p=0,027). A média do QTc (intervalo QT corrigido) foi de 384,03±23,2 no T1 e de 393,20±42,48 ms no T3 (p 0,023). A diferença entre os índices eletrocardiográficos entre o T1 e o T3 não foi significativa nos dois grupos etários.
ConclusãoA comparaçao dos resultados entre T1 e T3 revelou que os parâmetros médios dos índices eletrocardiográficos apresentaram diferenças estatísticas significativas. Tal facto contribui para esclarecer a abordagem de mulheres grávidas com queixas de palpitações que recorrem a consultas de cardiologia. Embora não seja estatisticamente significativo, a dispersão do QT foi 2% mais elevada nas participantes acima dos 30 anos.
Due to the vulnerability of pregnant women, their health is considered extremely important all over the world by national and global health authorities.1 Pregnancy makes women prone to significant changes in hemodynamic state such as plasma volume expansion, increase in heart rate and cardiac output and decrease in blood pressure. Pregnancy can be pro-arrhythmic due to fluctuations in sex hormones and increase in stretching of the cardiac chamber walls.2
Physiological electrocardiogram (ECG) changes occur in pregnancy such as sinus tachycardia, shift of the electrical axis, small Q wave, inverted T wave and ST-segment depression,3–7 which can mimic pathologic ones. On the other hand, with regard to the shift in cardiac position due to pressured diaphragm, left axis deviation can occur, especially in the third trimester.8,9 Event rate for cardiac arrhythmias is 166/100 000 in pregnancy-related admissions.10 The incidence of pregnancy induced arrhythmias increases as the fetus develops.11,12 Fortunately, most of the reported arrhythmias during pregnancy are benign and there is no need for intervention. Palpitations, atrial and ventricular premature beats and even life-threatening ventricular arrhythmias are also possible.13 The use of antiarrhythmic drugs is limited due to fetal toxicity, especially during the first trimester.14,15 There are little data regarding electrocardiographic changes in normal pregnancy. The aim of our study is to determine the changes in electrocardiographic indices during normal pregnancy.
MethodsThis prospective study was conducted at Tehran University of Medical Sciences, Iran between June and September 2018. Written informed consent was given and the local ethics committee approved the study (ethical code: 94-01-167-28302). A total of 103 consecutive pregnant women (age range between 18 to 35) in their first trimester routine obstetrics visit were recruited to the study, of whom 96 continued in the study. All of the subjects were completely healthy and free of any cardiovascular diseases. Exclusion criteria were subjects with history of chronic disease, moderate to severe valvular heart diseases, history of sudden cardiac death in first-degree relatives and history of use of heart rate control medications. Standard resting 12-lead surface ECGs were performed using a Schiller AT-104PC machine at the first visit in the first trimester (second month) and were repeated in the third trimester (8th month) again both in a quiet place after 30 minutes of rest. ECGs with too many artifacts were excluded and the remaining ECGs were analyzed with a high-resolution scanner and sent to two separate experienced cardiologists. The average duration of follow up was 6±0.2 months. The indices were reported separately by two cardiologists and in case of discrepancy in results a recheck was performed. The indices were: PR interval, as a marker of atrial conduction, expressed as the time interval between onsets of P wave to beginning of QRS complex was measured in leads with the shortest PR; QT interval, as a marker for duration of ventricular activation and recovery (depolarization and repolarization), determined as the time duration between beginning of QRS complex and the end of the T wave; QTc (corrected QT interval) was calculated using the Bazett formula; QT dispersion, as a measure of ventricular recovery, determined as variations in QT intervals; the longest QT interval in electrocardiograms was assessed in V2 or V3 or lead 2; JT interval, as an index of ventricular repolarization, measured from terminal point of QRS complex to end of the T wave; RR interval determined as time duration between two sequential QRS complexes; QRS duration measured in the lead with the widest QRS complex; TP segment, as a marker for proper voltage baseline, defined as the isoelectric interval between the end of the T wave and the next P wave.
Statistical analysisContinuous variables expressed as mean ± standard deviation. The paired sample T test was used to compare qualitative variables. The Pearson correlation coefficient was used for quantitative variables. The Mann-Whitney U test and Kruskal-Wallis H were used for analysis of statistical significance defined when p<0.05.
ResultsA total of 96 eligible pregnant women entered the study. The average age was 28±4.1 years. 39(40.6%) of patients were primiparous and 19(19.7%) were in their third pregnancy. None had a history of abortion. The mean body mass index was 23.10±1.9 kg/m2 and 28.01±2.6 kg/m2 in first and third trimester respectively (p<0.05). The electrocardiographic indices in the first and third trimester are illustrated in Table 1. None of the electrocardiograms showed signs of arrhythmia, atrioventricular or complete bundle branch block, ischemia, or infarction. Mean QT dispersion was 64.04±3.20 ms and 63.10±2.34 ms in T1 and T3, respectively (p=0.06). Mean QTc was 384.03±23.2 ms and 393.20±42.48 ms in T1 and T3 respectively (p=0.023). The positive linear correlation across all electrocardiographic parameters between first and third trimesters is shown in Table 2. As shown, the correlation was more robust in JT, TP and PR.
Electrocardiographic indices in the first and third trimester.
| Trimester 1 | Trimester 3 | p-value | |
|---|---|---|---|
| Mean±SD | Mean±SD | ||
| HR (bpm) | 83.68 | 91.83 | <0.001 |
| P wave duration | 88±7 | 84±6 | 0.060 |
| PR interval | 133.36±20.9 | 125.03±22.6 | 0.046 |
| QT interval | 314.30±18.9 | 324.02±19.4 | <0.001 |
| RR interval | 717.74±91.14 | 653.43±108.45 | <0.001 |
| JT interval | 223.97±73.59 | 229.14±77.64 | 0.052 |
| QRS duration | 90.24±28.91 | 94.97±10.79 | 0.027 |
| TP segment | 263.84±105.06 | 234.30±116.10 | 0.015 |
bpm: beat per minutes; HR: heart rate; SD: standard deviation.
All durations and intervals are in milliseconds.
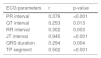
Linear correlation in electrocardiographic indices between first and third trimesters.
| ECG parameters | r | p-value |
|---|---|---|
| PR interval | 0.376 | <0.001 |
| QT interval | 0.253 | 0.013 |
| RR interval | 0.302 | 0.003 |
| JT interval | 0.945 | <0.001 |
| QRS duration | 0.294 | 0.004 |
| TP segment | 0.502 | <0.001 |
ECG: electrocardiogram; r: Pearson correlation coefficient.
Patients were categorized according to age groups (<30 and >30 years). Changes in electrocardiographic indices between trimesters according to age groups are depicted in Table 3. No statistically significant difference were observed in QRS duration, RR interval, QT, QT dispersion, PR and TP indices among pregnant women of different age groups (p>0.05). QT dispersion was 2% higher in participants >30 (p>0.05). 11 (11.4%) had premature rupture of membranes (PROM) and none had a still birth. Two participants had gestational hypertension, one had gestational diabetes and none had preeclampsia or eclampsia. No significant difference in electrocardiographic indices between both trimesters was observed in PROM (p>0.05).
The electrocardiogram indices change in first and third trimester in different age groups.
| Age group (years) | N | PR* | QT* | RR* | JT* | QRS* | TP* | QTc* |
|---|---|---|---|---|---|---|---|---|
| Mean±SD | Mean±SD | Mean±SD | Mean±SD | Mean±SD | Mean±SD | Mean±SD | ||
| 20-30 | 65 | 9.43±17.3 | 8.4±25 | 55.6±114.2 | 3.1±25.6 | 2.7±9.5 | 24.4±117.5 | 7.8±47 |
| >30 | 31 | 6±18 | 12.6±20.1 | 82.5±127.7 | 8.7±26.3 | 14.1±46.4 | 34.6±81.3 | 12±55.1 |
| p-value | 0.336 | 0.306 | 0.235 | 0.317 | 0.190 | 0.261 | 0.823 |
*in milliseconds.
Due to the vast hemodynamic burden on the cardiovascular system, correct interpretation of ECG during pregnancy is crucial. The main finding of our study is that the mean RR, PR, TP interval and QT dispersion in surface electrocardiogram decreased significantly between T1 and T3. JT interval and P wave duration also declined but the difference was not statistically significant. QT and QTc increased significantly. However, all of these indices were in normal range in both trimesters. Heart rate in pregnant women increases gradually towards term as stroke volume decreases in order to maintain cardiac output.5 As a result, sinus tachycardia leads to decreasing RR interval. In our study, the mean heart rate in T1 was 83.68 and T3 was 91.83. The approximately 10 beat per minute increase in heart rate was significant and similar to results in other studies.16 In the present study, PR interval decreased in the third trimester. The shortening of PR indicated acceleration of AV node conduction velocity due to increased sympathetic activity. Despite the fact that QT prolongation can be pro-arrhythmic, the prolongation of the QTc interval during pregnancy does not lead clearly to life-threatening cardiac arrhythmias. However, the risk may increase even when there is not any visible heart disease.17 Our study demonstrated that compared to the first trimester, QT increased significantly in the third trimester. As claimed by Odening and Forbes, progesterone shortens cardiac repolarization and can cause QTc prolongation in pregnancy, although the risk of arrhythmias does not increase.18,19 The increase in mean QTc between T1 and T3 as demonstrated in our study was similar to other studies.16,20,21 However, this change is benign and is a component of the normal electrophysiological state in pregnant women. In a study conducted by Seth et al. on pregnant women with long QT syndrome, the risk of cardiac events decreased during pregnancy.22 QT dispersion is considered as an indicator of the total variability in timing and regional heterogeneity of myocardial repolarization which may be able to predict susceptibility to ventricular arrhythmias.17,23,24 Disturbances in ventricular repolarization occurring in pregnancy can explain the relative prolongation of QT dispersion in T325. The TP interval indicates silent time of cardiac electrical activity. The TP interval in the third trimester reduced significantly, which can be explained by the increased heart rate. In total, based on the literature, the incidence of cardiac arrhythmias would rise during pregnancy due to hemodynamic, autonomic, and hormonal changes and previous cardiovascular abnormalities.4,25–28
Small sample size and short-term follow up were the main limitation of the study; longer follow up from perinatal to postpartum period would be of great value. A case-control study to compare results in pregnant women with a history of cardiovascular disease is recommended. In addition, some hidden cardiac and systemic diseases may not be diagnosed by routine ECG.
ConclusionsA comparison of results between T1 and T3, mean parameters of electrocardiogram indices showed significant statistical difference. QT dispersion was 2% higher in participants >30, however this was not statistically significant.
Financial disclosureNone
Conflict of interestThe authors have no conflicts of interest to declare.
The authors are grateful to Dr. Zahar Tavoli, Dr Zahra Ebrahimi, Dr Mohsen Ghanei and all staffs of obstetric and gynecologic ward for their support.
