


Cardiogenic shock (CS) has long been considered a contraindication for the use of non-invasive ventilation (NIV). The main objective of this study was to analyze the effectiveness, measured as NIV success, in patients with respiratory failure due to CS. As secondary objective, we studied risk factors for NIV failure and compared the outcome of patients treated with NIV versus invasive mechanical ventilation (IMV).
MethodsRetrospective study on a prospective database, over a period of 25 years, of all consecutively patients admitted to an intensive care unit, with a diagnosis of CS and treated with NIV. A comparison was made between patients on NIV and patients on IMV using propensity score matching analysis.
ResultsThree hundred patients were included, mean age 73.8 years, mean SAPS II 49. The main cause of CS was acute myocardial infarction (AMI): 164 (54.7%). NIV failure occurred in 153 (51%) cases. Independent factors for NIV failure included D/E stages of CS, AMI, NIV related complications, and being transferred from the ward. In the propensity analysis, hospital mortality (OR 1.69, 95% CI 1.09–2.63) and 1 year mortality (OR 1.61, 95% CI 1.04–2.51) was higher in IMV. Mortality was lower with NIV (vs. EIT-IMV) in C stage (10.1% vs. 32.9%; p<0.001) but did not differ in D stage or E stage.
ConclusionsNIV seems to be relatively effective and safe in the treatment of early-stage CS.
O choque cardiogénico (CC) tem sido considerado uma contraindicação para o uso de ventilação não-invasiva (VNI). O principal objetivo deste estudo foi analisar a eficácia, medida como sucesso da VNI, em doentes com insuficiência respiratória devido a CC. Como objetivo secundário, foram estudados os fatores de risco para falência da VNI e foram comparados os resultados de doentes tratados com VNI com doentes submetidos a ventilação mecânica invasiva (VMI).
MétodosAnálise retrospetiva de uma base de dados prospetiva, durante um período de 25 anos, de todos os doentes consecutivamente internados numa Unidade de Cuidados Intensivos, com diagnóstico de CC e tratados com VNI. Foi feita uma comparação entre doentes sob VNI e doentes sob VMI através de análise de propensão.
ResultadosForam incluídos 300 doentes, idade média de 73,8 anos, SAPS II médio de 49. A principal causa de CC foi enfarte agudo do miocárdio (EAM): 164 (54,7%). Verificou-se falência da VNI em 153 (51%) casos. Fatores independentes para falência da VNI incluíram estadios D/E de CC, EAM, complicações relacionadas com a VNI e o doente ter sido transferido de enfermaria. Na análise de propensão, a mortalidade hospitalar (OR 1,69, IC 95% 1,09-2,63) e mortalidade a um ano (OR 1,61, IC 95% 1,04-2,51) foram maiores na VMI. A mortalidade foi menor na VNI (vs. EIT-IMV) no estadio C (10,1% vs. 32,9%; p<0,001), mas não foi diferente nos estadios D ou E.
ConclusõesA VNI parece ser eficaz e segura no tratamento do CC em estadio inicial.
Heart failure (HF) is a complex clinical syndrome characterized by signs and symptoms caused by a structural and/or functional cardiac abnormality, resulting in a reduced cardiac output and/or elevated intracardiac pressures that produces pulmonary and systemic congestion.1 Acute respiratory failure (ARF) due to acute cardiogenic pulmonary edema is one of the main presenting causes to emergency department.2 Cardiogenic shock (CS) is less frequent.3 In CS, the predominant signs and symptoms are those from arterial hypotension and end-organ hypoperfusion caused by decreased cardiac output and decreased oxygen delivery to tissues. The main cause of cardiogenic shock is acute coronary syndrome (ACS), with CS currently affecting less than 5% of acute myocardial infarction (AMI) patients. Despite treatment advances, CS is associated with very high mortality.4
As a result of the introduction of non-invasive ventilation (NIV) and high-flow oxygen through nasal cannula (HFNC), many patients with acute cardiogenic pulmonary edema can be treated effectively avoiding endotracheal intubation (ETI).5–7 However, CS has been considered a contraindication (at least relative) for NIV,8 and due to this, it was an exclusion criterion in clinical trials where NIV efficacy in acute respiratory failure was evaluated. Despite this, in the real world, NIV has been used, although infrequently, in patients with CS. In a recent survey of senior intensive care physicians from France and Belgium, NIV was considered an appropriate therapy for CS.9 Different studies have reported the use of NIV in patients with CS, with less than 15% of hypotensive patients receiving NIV,10–18 which demonstrates a decrease in NIV use in recent years in some cases.12 While in others, there is evidence of an increase in NIV use.13 Although the presence of CS should not be considered an absolute contraindication for NIV, as is the case in other forms of shock,19 the presence of hypotension and the need for vasoactive drugs is a risk factor for NIV failure.20
ObjectivesWe hypothesized that NIV can be used in patients with CS who are rapidly stabilized with vasoactive drugs. The main objective of this study was to analyze the effectiveness, measured as NIV success, in patients with respiratory failure due to CS. As secondary objective, we studied risk factors for NIV failure. We then compared the outcome of patients treated with NIV versus invasive mechanical ventilation (IMV), using propensity score matching analysis.
Materials and methodsPatientsIn this cohort study, we analyzed retrospectively, from a prospective database, all patients who were admitted consecutively with CS and received treatment with NIV in the 18-bed intensive care unit (ICU) of the Morales Meseguer University Hospital in Murcia, Spain, between January 1997 and December 2021. The study was approved by the ethics committee of the institution.
Cardiogenic shock was defined by systolic blood pressure <90 mmHg for at least 30 minutes despite appropriate fluid resuscitation or need for vasopressor support to maintain systolic pressure above this level, plus signs or symptoms of hypoperfusion (altered mental status, cool extremities, oliguria with urine output less than 0.5 milliliters/kilogram/hour for at least 6 hours, serum lactate >2 mmol/L). The cardiac etiology of the shock required confirmation by echocardiography or invasive monitoring of pulmonary pressures and cardiac output.
Inclusion criteria were respiratory failure of cardiac cause defined by the presence of a respiratory rate >30 breaths per minute or use of respiratory accessory muscles, in addition to PaO2/FiO2 <250 mmHg, or respiratory acidosis (arterial pH <7.35 with PaCO2 >45 mmHg). The exclusion criteria were uncontrollable ventricular arrhythmias, shock due to right ventricular dysfunction, severe multiorgan failure at admission, cardiorespiratory deterioration or cardiac arrest requiring immediate ETI, decreased cardiac contractibility due to septic shock and transfer to another hospital for coronary surgery in the first 12 hours of ICU admission.
Cardiogenic shock was classified by its etiology as secondary to ACS-AMI or other cause (chronic coronary artery disease, valvular disease, arrhythmia). The diagnosis of ACS-AMI was made according to the criteria in force at the time of admission.21–24 Before the first universal definition of AMI, when the patient presented a clinical condition compatible with cardiac ischemia, accompanied by elevation of cardiac markers or suggestive electrocardiographic changes, AMI was considered. In relation to cardiac markers, pathological an elevation of CPK above twice the considered normal value and a CPK-Mb above 10% of total CPK, were the criteria. Once the use of troponin I became standard in 2001, the cut-off point used was 0.04 ng/ml. During the early years of the study, patients were classified as myocardial infarction with and without Q wave. These patients were subsequently reclassified as ST segment elevation myocardial infarction (STEMI) and non-ST segment elevation myocardial infarction (NSTEMI) or indeterminate (presence of pacemaker or complete left bundle branch block). All electrocardiograms were evaluated by at least two intensivist physicians with extensive experience in coronary patients, and doubtful cases had the opinion of a third intensivist and subsequently were corroborated by the cardiologist on the ward. The assignment of the severity of CS was also carried out subsequently, using the patients’ data from the first 24 hours of ICU admission.25 The reclassification was carried out blinded to the outcome of the patients.
The patients under analysis were classified as de novo HF if they presented typical symptoms and signs of HF for the first time and there was no previous history of HF, and as acute decompensated HF if they showed worsening of a preexisting HF.26
The clinical management of patients is shown in the Supplementary Material. All patients underwent a bedside echocardiography in the first 12 hours of ICU admission, assessing the impact of the global and segmental contractility of the left ventricle, dimensions of the cardiac cavities, possible mechanical complications in patients with ACS, involvement of the contractibility and size of the right ventricle, and, if possible, the filling pressures of the cardiac cavities.
Non-invasive ventilation protocolAn indication for non-invasive ventilation indication was established by the attending physician. All patients were continuously monitored by electrocardiogram, pulse oximetry, blood pressure and respiratory rate. NIV protocol is shown in Supplementary Material.
In all patients, an arterial blood gas control was performed in the first hour after NIV initiation. Subsequent arterial blood gas controls were performed according to the attending physician, considering the clinical status and evolution of the patient.
Effectiveness of non-invasive ventilationNon-invasive ventilation failure was defined as the need for ETI in a patient with deterioration of respiratory parameters despite NIV optimization, and/or death in the ICU. In case of NIV failure due to deterioration, the patient was intubated and connected to mechanical ventilation, according to previously published criteria.19,27 Patients with a do not intubate (DNI) order received non-invasive support until improvement or death.
Collected variablesDemographic, clinical and laboratory variables were recorded at NIV initiation. At ICU admission, body mass index was calculated for all patients. The degree of disease severity during the first 24 hours in the ICU was obtained by calculating the Simplified Acute Physiology Score II (SAPS II), and the degree of multiorgan dysfunction through the Sequential Organ Failure Assessment (SOFA) score, measured daily. To quantify patient comorbidities, the Charlson Comorbidity Index was calculated. Anemia was defined as Hb <12 g/dl in women and <13 g/dl in men. Classification CS severity was performed at the beginning of NIV and in the first 24 hours after admission while receiving NIV. The Society for Cardiovascular Angiography and Interventions (SCAI) classification of cardiogenic shock was used, subsequently assigning the patients to each of the stages.28,29 The SCAI Shock is divided into five stages: A: patients at risk of cardiogenic shock; B: pre-shock state, patients with arterial hypotension but with normal tissue perfusion; C: tissue hypoperfusion without treatment, or requiring pharmacological hemodynamic support or mechanical intervention; D: tissue hypoperfusion that does not respond to an adequate trial of an initial supportive intervention; and E: refractory shock that does not respond despite escalation of treatment and the patient is in severe cardiovascular collapse including arrest in progress.28,29 The HACOR score was measured at 1 hour after starting NIV.30 The HACOR score integrates the results of the hemodynamic (heart rate), respiratory (respiratory rate, arterial pH and ratio PaO2/FiO2), and neurological parameters (Glasgow Coma Scale) of the patient. The usefulness of HACOR in the prediction of NIV failure has been clearly established in hypoxemic ARF of different etiologies.30 Definitions of the complications analyzed are shown in Supplementary Material. Mortality was assessed in ICU and during hospital stay, and at one year.
Statistical analysisQualitative or categorical variables were expressed as absolute and relative frequencies, and comparisons between them were made using Pearson's chi-square test or Fisher's exact test. Quantitative variables were expressed as mean±standard deviation or median (interquartile range – IQR), and the comparison between independent groups using the Student's t-test or Mann–Whitney U test if the variable did not follow normal distribution. The measures of association analyzed were odds ratio (OR) with 95% confidence intervals (95% CI). Independent risk factors for developing NIV failure were analyzed using logistic regression. Variables identified as predictors of NIV failure in the univariate analysis, together with those considered relevant, were included in a multivariate logistic regression model using the stepwise forward method (PIN\0.10, POUT\0.05) to correct collinearity.
Propensity score matching was produced using nearest-neighbor model without replace, with a 1:1 ratio.31 Each patient with CS-NIV was matched to one control patient with the nearest-neighbor matching within calipers determined by the propensity score. Variables used for matching included: year to admission, age, gender, acute coronary syndrome, SAPS II, initial SOFA, Charlson Index, left ventricular ejection fraction (LVEF), location of the patient before admission to the ICU, type of AHF–de novo or acute on chronic HF, NYHA class and DNI order. A caliper width of 0.1 of the standard deviation of the logit of the propensity score was used for the matching. To determine the effectiveness of the propensity score matching for controlling the differences between patients with and without NIV, standardized mean differences (SMDs) were calculated for each variable before and after matching. SMDs <10% indicated successful propensity scores matching and balancing between the two groups. The analysis was performed using the SPSS 25.0® program (IBM™, Armonk, NY) and R version 3.4.0® (Copyright 2017 The R Foundation for Statistical Computing Platform™).
ResultsDuring the study period, 8694 ACS-AMI patients were admitted to the ICU; 492 (0.6%) of whom presented CS. In addition, there were 206 patients with CS unrelated to ACS. Of the 698 patients with CS, 300 (43%) received NIV (Figure 1); NIV failure was observed in 153 cases (51%).

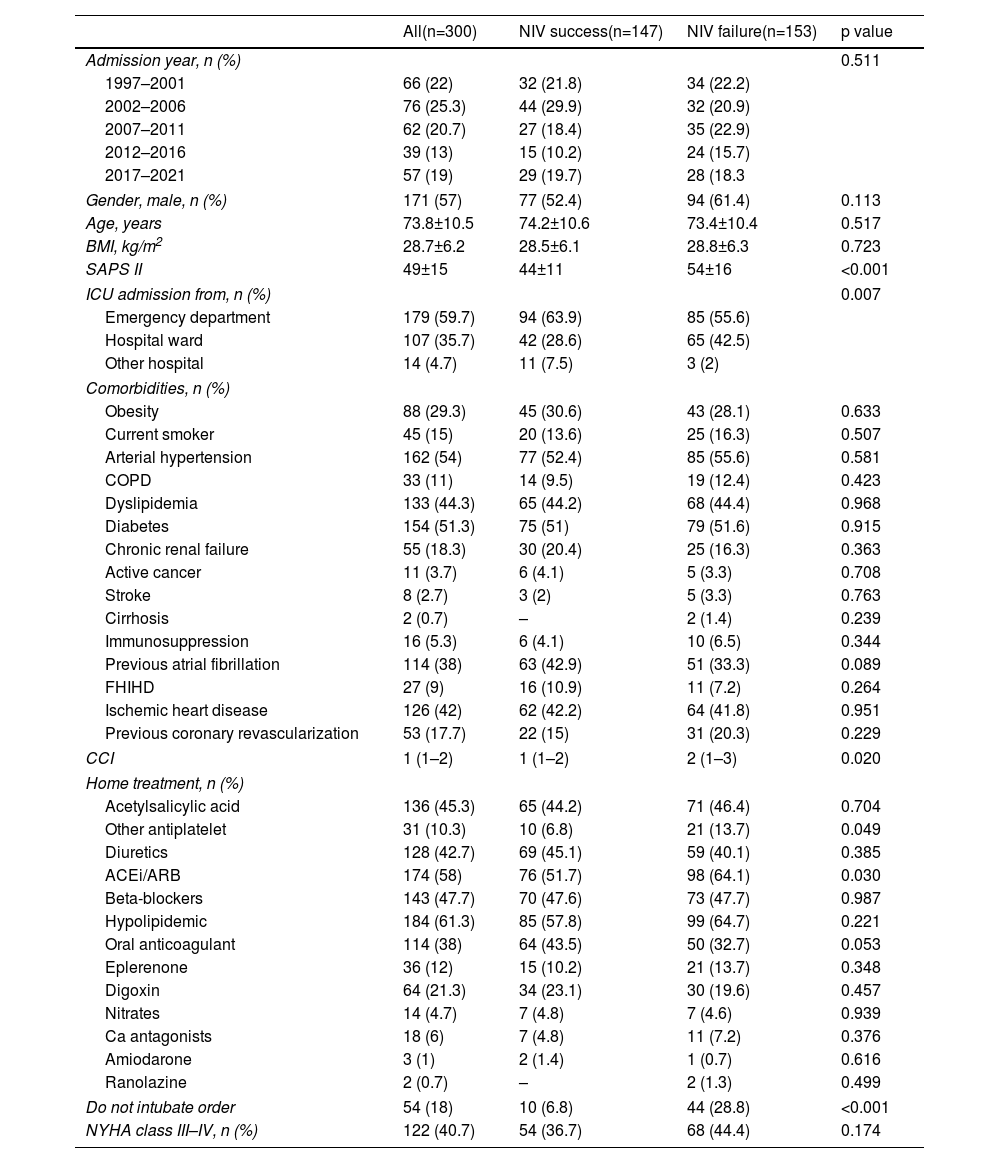
The main sociodemographic and clinical background and characteristics are shown in Table 1. There was a slight predominance of male gender (57%), advanced age (mean of 73.8 years) and low comorbidities, measured by the Charlson Index. Of the variables analyzed, SAPS II index, ward origin, comorbidity index and the presence of DNI order were higher in patients with NIV failure.
Sociodemographic and clinical characteristics.
| All(n=300) | NIV success(n=147) | NIV failure(n=153) | p value | |
|---|---|---|---|---|
| Admission year, n (%) | 0.511 | |||
| 1997–2001 | 66 (22) | 32 (21.8) | 34 (22.2) | |
| 2002–2006 | 76 (25.3) | 44 (29.9) | 32 (20.9) | |
| 2007–2011 | 62 (20.7) | 27 (18.4) | 35 (22.9) | |
| 2012–2016 | 39 (13) | 15 (10.2) | 24 (15.7) | |
| 2017–2021 | 57 (19) | 29 (19.7) | 28 (18.3 | |
| Gender, male, n (%) | 171 (57) | 77 (52.4) | 94 (61.4) | 0.113 |
| Age, years | 73.8±10.5 | 74.2±10.6 | 73.4±10.4 | 0.517 |
| BMI, kg/m2 | 28.7±6.2 | 28.5±6.1 | 28.8±6.3 | 0.723 |
| SAPS II | 49±15 | 44±11 | 54±16 | <0.001 |
| ICU admission from, n (%) | 0.007 | |||
| Emergency department | 179 (59.7) | 94 (63.9) | 85 (55.6) | |
| Hospital ward | 107 (35.7) | 42 (28.6) | 65 (42.5) | |
| Other hospital | 14 (4.7) | 11 (7.5) | 3 (2) | |
| Comorbidities, n (%) | ||||
| Obesity | 88 (29.3) | 45 (30.6) | 43 (28.1) | 0.633 |
| Current smoker | 45 (15) | 20 (13.6) | 25 (16.3) | 0.507 |
| Arterial hypertension | 162 (54) | 77 (52.4) | 85 (55.6) | 0.581 |
| COPD | 33 (11) | 14 (9.5) | 19 (12.4) | 0.423 |
| Dyslipidemia | 133 (44.3) | 65 (44.2) | 68 (44.4) | 0.968 |
| Diabetes | 154 (51.3) | 75 (51) | 79 (51.6) | 0.915 |
| Chronic renal failure | 55 (18.3) | 30 (20.4) | 25 (16.3) | 0.363 |
| Active cancer | 11 (3.7) | 6 (4.1) | 5 (3.3) | 0.708 |
| Stroke | 8 (2.7) | 3 (2) | 5 (3.3) | 0.763 |
| Cirrhosis | 2 (0.7) | – | 2 (1.4) | 0.239 |
| Immunosuppression | 16 (5.3) | 6 (4.1) | 10 (6.5) | 0.344 |
| Previous atrial fibrillation | 114 (38) | 63 (42.9) | 51 (33.3) | 0.089 |
| FHIHD | 27 (9) | 16 (10.9) | 11 (7.2) | 0.264 |
| Ischemic heart disease | 126 (42) | 62 (42.2) | 64 (41.8) | 0.951 |
| Previous coronary revascularization | 53 (17.7) | 22 (15) | 31 (20.3) | 0.229 |
| CCI | 1 (1–2) | 1 (1–2) | 2 (1–3) | 0.020 |
| Home treatment, n (%) | ||||
| Acetylsalicylic acid | 136 (45.3) | 65 (44.2) | 71 (46.4) | 0.704 |
| Other antiplatelet | 31 (10.3) | 10 (6.8) | 21 (13.7) | 0.049 |
| Diuretics | 128 (42.7) | 69 (45.1) | 59 (40.1) | 0.385 |
| ACEi/ARB | 174 (58) | 76 (51.7) | 98 (64.1) | 0.030 |
| Beta-blockers | 143 (47.7) | 70 (47.6) | 73 (47.7) | 0.987 |
| Hypolipidemic | 184 (61.3) | 85 (57.8) | 99 (64.7) | 0.221 |
| Oral anticoagulant | 114 (38) | 64 (43.5) | 50 (32.7) | 0.053 |
| Eplerenone | 36 (12) | 15 (10.2) | 21 (13.7) | 0.348 |
| Digoxin | 64 (21.3) | 34 (23.1) | 30 (19.6) | 0.457 |
| Nitrates | 14 (4.7) | 7 (4.8) | 7 (4.6) | 0.939 |
| Ca antagonists | 18 (6) | 7 (4.8) | 11 (7.2) | 0.376 |
| Amiodarone | 3 (1) | 2 (1.4) | 1 (0.7) | 0.616 |
| Ranolazine | 2 (0.7) | – | 2 (1.3) | 0.499 |
| Do not intubate order | 54 (18) | 10 (6.8) | 44 (28.8) | <0.001 |
| NYHA class III–IV, n (%) | 122 (40.7) | 54 (36.7) | 68 (44.4) | 0.174 |
Quantitative variables are expressed as means±standard deviation or median (interquartile range).
ACEi: angiotensin converting enzyme inhibitors; ARB: angiotensin receptor blocker; BMI: body mass index; CCI: Charlson Comorbidity Index; COPD: chronic obstructive pulmonary disease; FHIHD: family history of ischemic heart disease; ICU: intensive care unit; NIV: non-invasive ventilation; SAPS: Simplified Acute Physiology Score.
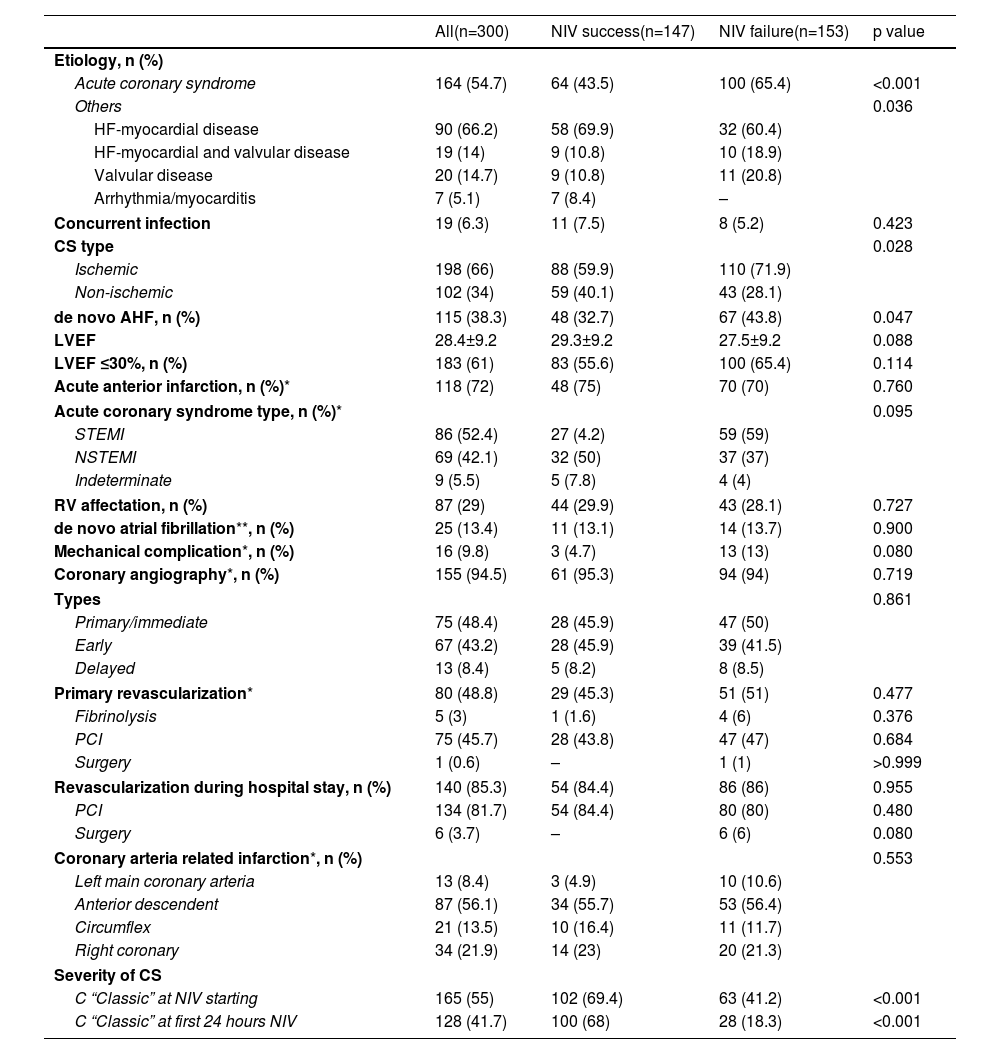
The main characteristics related to heart disease are shown in Table 2. The most frequent etiology was ACS-AMI (54.7%). One hundred and fifteen patients (38.3%) had de novo AHF, while the rest had previous chronic HF. The presence of ACS and de novo AHF was related to higher NIV failure rate. Of the 164 patients with ACS-AMI, coronary angiography was performed in 155 (94.5%), immediate in 48.4%, early in 43.2% and delayed in 8.4%. Nine patients died without having undergone coronary angiography. Primary revascularization was performed in 48.8% of the patients and coronary revascularization in 83.4% during the hospital stay. Severity of CS was related to NIV failure: among patients with NIV success, 68% were C stage, 28.6% stage D and 3.4% stage E, while in the NIV failure group, 18.3%, 32.7% and 49%, respectively (p<0.001). The cardiological treatments used during the ICU stay are shown in Table S1 (Supplementary Material).
Cardiopathy characteristics.
| All(n=300) | NIV success(n=147) | NIV failure(n=153) | p value | |
|---|---|---|---|---|
| Etiology, n (%) | ||||
| Acute coronary syndrome | 164 (54.7) | 64 (43.5) | 100 (65.4) | <0.001 |
| Others | 0.036 | |||
| HF-myocardial disease | 90 (66.2) | 58 (69.9) | 32 (60.4) | |
| HF-myocardial and valvular disease | 19 (14) | 9 (10.8) | 10 (18.9) | |
| Valvular disease | 20 (14.7) | 9 (10.8) | 11 (20.8) | |
| Arrhythmia/myocarditis | 7 (5.1) | 7 (8.4) | – | |
| Concurrent infection | 19 (6.3) | 11 (7.5) | 8 (5.2) | 0.423 |
| CS type | 0.028 | |||
| Ischemic | 198 (66) | 88 (59.9) | 110 (71.9) | |
| Non-ischemic | 102 (34) | 59 (40.1) | 43 (28.1) | |
| de novo AHF, n (%) | 115 (38.3) | 48 (32.7) | 67 (43.8) | 0.047 |
| LVEF | 28.4±9.2 | 29.3±9.2 | 27.5±9.2 | 0.088 |
| LVEF ≤30%, n (%) | 183 (61) | 83 (55.6) | 100 (65.4) | 0.114 |
| Acute anterior infarction, n (%)* | 118 (72) | 48 (75) | 70 (70) | 0.760 |
| Acute coronary syndrome type, n (%)* | 0.095 | |||
| STEMI | 86 (52.4) | 27 (4.2) | 59 (59) | |
| NSTEMI | 69 (42.1) | 32 (50) | 37 (37) | |
| Indeterminate | 9 (5.5) | 5 (7.8) | 4 (4) | |
| RV affectation, n (%) | 87 (29) | 44 (29.9) | 43 (28.1) | 0.727 |
| de novo atrial fibrillation**, n (%) | 25 (13.4) | 11 (13.1) | 14 (13.7) | 0.900 |
| Mechanical complication*, n (%) | 16 (9.8) | 3 (4.7) | 13 (13) | 0.080 |
| Coronary angiography*, n (%) | 155 (94.5) | 61 (95.3) | 94 (94) | 0.719 |
| Types | 0.861 | |||
| Primary/immediate | 75 (48.4) | 28 (45.9) | 47 (50) | |
| Early | 67 (43.2) | 28 (45.9) | 39 (41.5) | |
| Delayed | 13 (8.4) | 5 (8.2) | 8 (8.5) | |
| Primary revascularization* | 80 (48.8) | 29 (45.3) | 51 (51) | 0.477 |
| Fibrinolysis | 5 (3) | 1 (1.6) | 4 (6) | 0.376 |
| PCI | 75 (45.7) | 28 (43.8) | 47 (47) | 0.684 |
| Surgery | 1 (0.6) | – | 1 (1) | >0.999 |
| Revascularization during hospital stay, n (%) | 140 (85.3) | 54 (84.4) | 86 (86) | 0.955 |
| PCI | 134 (81.7) | 54 (84.4) | 80 (80) | 0.480 |
| Surgery | 6 (3.7) | – | 6 (6) | 0.080 |
| Coronary arteria related infarction*, n (%) | 0.553 | |||
| Left main coronary arteria | 13 (8.4) | 3 (4.9) | 10 (10.6) | |
| Anterior descendent | 87 (56.1) | 34 (55.7) | 53 (56.4) | |
| Circumflex | 21 (13.5) | 10 (16.4) | 11 (11.7) | |
| Right coronary | 34 (21.9) | 14 (23) | 20 (21.3) | |
| Severity of CS | ||||
| C “Classic” at NIV starting | 165 (55) | 102 (69.4) | 63 (41.2) | <0.001 |
| C “Classic” at first 24 hours NIV | 128 (41.7) | 100 (68) | 28 (18.3) | <0.001 |
Quantitative variables are expressed as means±standard deviation or median (interquartile range).
AHF: acute heart failure; CS: cardiogenic shock; HF: heart failure; ICU: intensive care unit; LVEF: left ventricular ejection fraction; NIV: non-invasive ventilation; NSTEMI: non-ST segment elevation myocardial infarction; PCI: percutaneous coronary intervention; RV: right ventricle; SAPS: Simplified Acute Physiology Score; STEMI: ST segment elevation myocardial infarction.
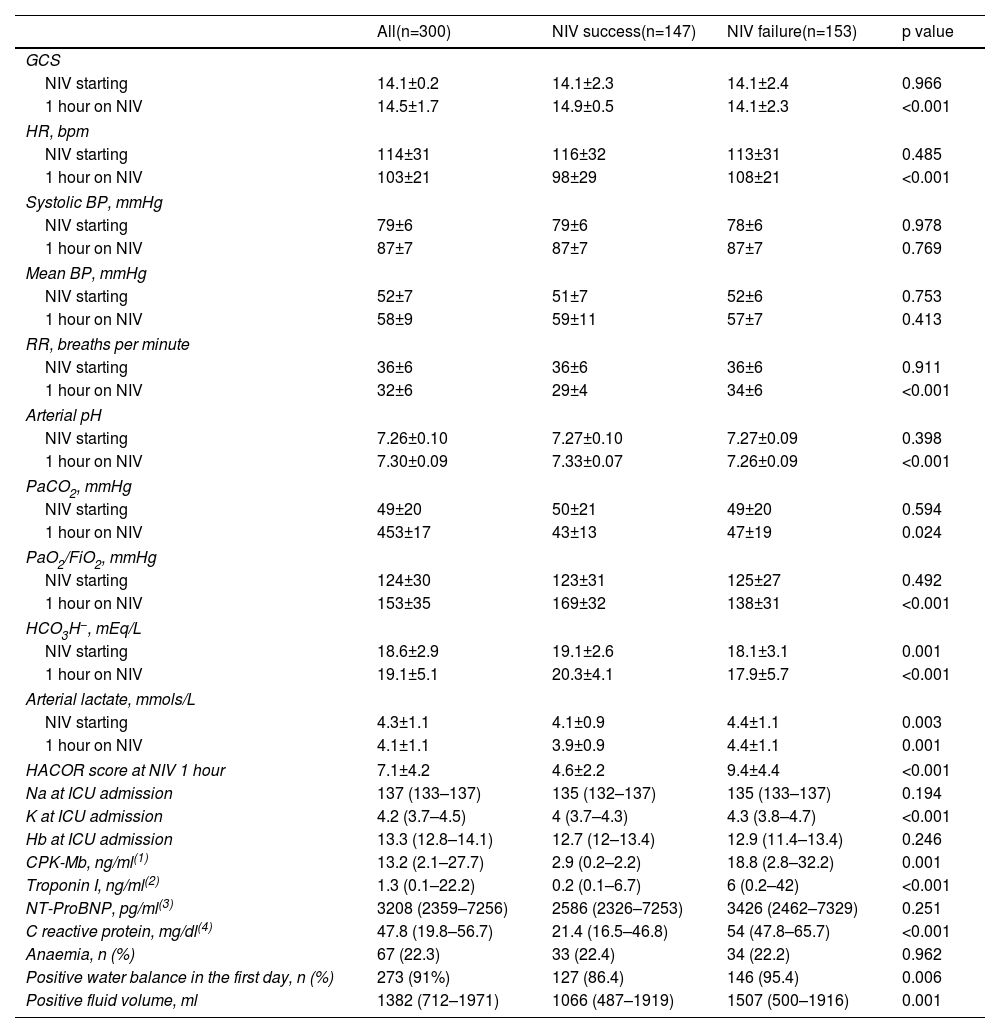
Respiratory, hemodynamic, and neurological parameters, before and after 1 hour of NIV, are shown in Table 3. Initial values reflected severe hemodynamic deterioration, with mixed metabolic and respiratory acidosis, elevated lactate levels, high heart, and respiratory rates, altered mental status and severe hypoxemia. Most parameters at the start of NIV did not differ between NIV success and failure. The presence of a positive fluid balance in the first 24 hours of ICU stay as well as the total volume of fluids were higher in NIV failure (p=0.006 and p=0.001, respectively).
Neurologic, hemodynamic, respiratory and laboratory variables.
| All(n=300) | NIV success(n=147) | NIV failure(n=153) | p value | |
|---|---|---|---|---|
| GCS | ||||
| NIV starting | 14.1±0.2 | 14.1±2.3 | 14.1±2.4 | 0.966 |
| 1 hour on NIV | 14.5±1.7 | 14.9±0.5 | 14.1±2.3 | <0.001 |
| HR, bpm | ||||
| NIV starting | 114±31 | 116±32 | 113±31 | 0.485 |
| 1 hour on NIV | 103±21 | 98±29 | 108±21 | <0.001 |
| Systolic BP, mmHg | ||||
| NIV starting | 79±6 | 79±6 | 78±6 | 0.978 |
| 1 hour on NIV | 87±7 | 87±7 | 87±7 | 0.769 |
| Mean BP, mmHg | ||||
| NIV starting | 52±7 | 51±7 | 52±6 | 0.753 |
| 1 hour on NIV | 58±9 | 59±11 | 57±7 | 0.413 |
| RR, breaths per minute | ||||
| NIV starting | 36±6 | 36±6 | 36±6 | 0.911 |
| 1 hour on NIV | 32±6 | 29±4 | 34±6 | <0.001 |
| Arterial pH | ||||
| NIV starting | 7.26±0.10 | 7.27±0.10 | 7.27±0.09 | 0.398 |
| 1 hour on NIV | 7.30±0.09 | 7.33±0.07 | 7.26±0.09 | <0.001 |
| PaCO2, mmHg | ||||
| NIV starting | 49±20 | 50±21 | 49±20 | 0.594 |
| 1 hour on NIV | 453±17 | 43±13 | 47±19 | 0.024 |
| PaO2/FiO2, mmHg | ||||
| NIV starting | 124±30 | 123±31 | 125±27 | 0.492 |
| 1 hour on NIV | 153±35 | 169±32 | 138±31 | <0.001 |
| HCO3H−, mEq/L | ||||
| NIV starting | 18.6±2.9 | 19.1±2.6 | 18.1±3.1 | 0.001 |
| 1 hour on NIV | 19.1±5.1 | 20.3±4.1 | 17.9±5.7 | <0.001 |
| Arterial lactate, mmols/L | ||||
| NIV starting | 4.3±1.1 | 4.1±0.9 | 4.4±1.1 | 0.003 |
| 1 hour on NIV | 4.1±1.1 | 3.9±0.9 | 4.4±1.1 | 0.001 |
| HACOR score at NIV 1 hour | 7.1±4.2 | 4.6±2.2 | 9.4±4.4 | <0.001 |
| Na at ICU admission | 137 (133–137) | 135 (132–137) | 135 (133–137) | 0.194 |
| K at ICU admission | 4.2 (3.7–4.5) | 4 (3.7–4.3) | 4.3 (3.8–4.7) | <0.001 |
| Hb at ICU admission | 13.3 (12.8–14.1) | 12.7 (12–13.4) | 12.9 (11.4–13.4) | 0.246 |
| CPK-Mb, ng/ml(1) | 13.2 (2.1–27.7) | 2.9 (0.2–2.2) | 18.8 (2.8–32.2) | 0.001 |
| Troponin I, ng/ml(2) | 1.3 (0.1–22.2) | 0.2 (0.1–6.7) | 6 (0.2–42) | <0.001 |
| NT-ProBNP, pg/ml(3) | 3208 (2359–7256) | 2586 (2326–7253) | 3426 (2462–7329) | 0.251 |
| C reactive protein, mg/dl(4) | 47.8 (19.8–56.7) | 21.4 (16.5–46.8) | 54 (47.8–65.7) | <0.001 |
| Anaemia, n (%) | 67 (22.3) | 33 (22.4) | 34 (22.2) | 0.962 |
| Positive water balance in the first day, n (%) | 273 (91%) | 127 (86.4) | 146 (95.4) | 0.006 |
| Positive fluid volume, ml | 1382 (712–1971) | 1066 (487–1919) | 1507 (500–1916) | 0.001 |
Quantitative variables are expressed as means±of or median (interquartile range).
BP: blood pressure; CPK-Mb: creatin phosphokinase fraction Mb; FiO2: inspiratory oxygen fraction; GCS: Glasgow coma score; HACOR: heart rate, acidosis, consciousness, oxygenation, and respiratory rate score; Hb: hemoglobin; HCO3−: bicarbonate; HR: heart rate; mEq/L: milliequivalents per liter; mmHg: millimeters of mercury; mmols/L: millimoles per liter; ng/ml: nanogram per milliliter; NT-ProBNP: aminoterminal fraction of type B natriuretic propertied; PaCO2: carbon dioxide partial pressure; PaO2: oxygen partial pressure; pg/ml: picogram per milliliter; RR: respiratory rate.
(1) 12 missing values; (2) 20 missing values; (3) 25 missing values; (4) 41 missing values.
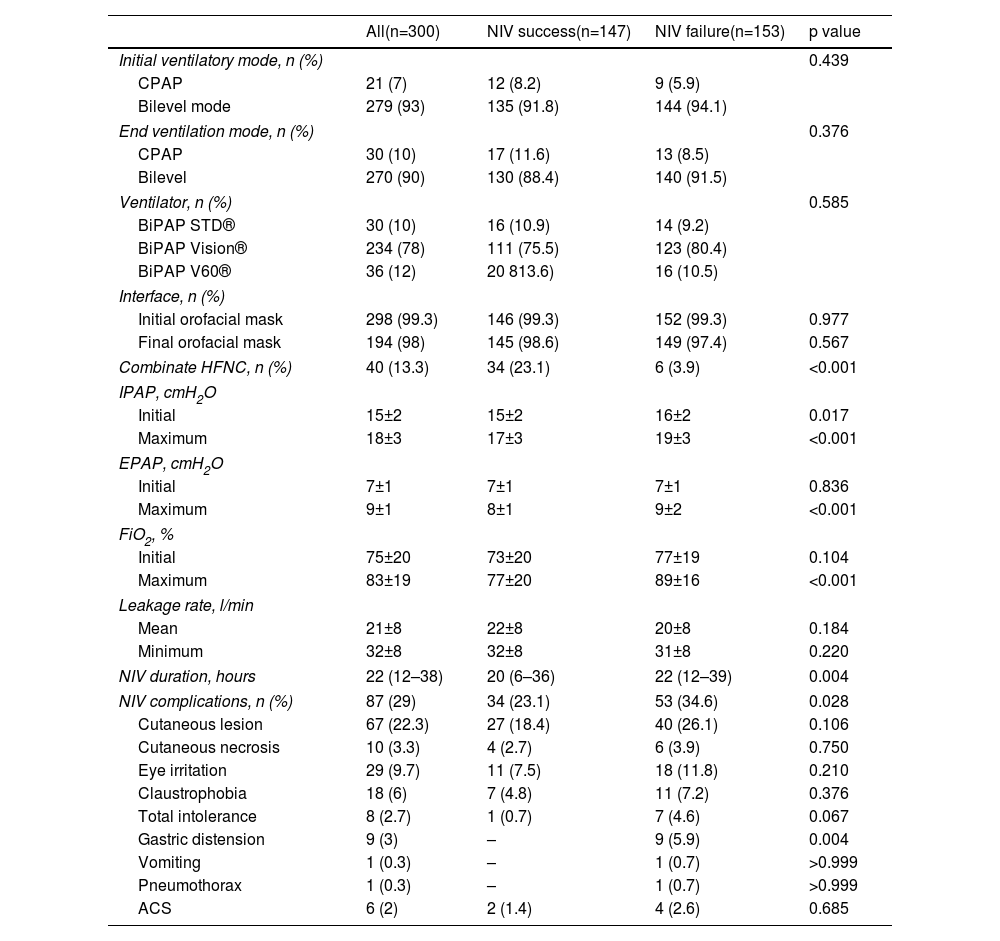
Two hundred seventy-nine (93%) patients were treated with NIV in bilevel mode, and the rest in CPAP mode (Table 4). The mean level of IPAP and EPAP at baseline was 15±2 cmH2O and 7±1 cmH2O, respectively, and maximum levels reached were 18±3 cmH2O and 9±1 cmH2O, respectively. IPAP and EPAP levels were higher in patients with NIV failure (p<0.001). The median duration of NIV was 22 hours (IQR=12–38). Patients with NIV success used NIV for shorter periods (median 20 hours), than patients in the NIV failure group (median 22 hours) (p=0.004). Eighty-seven (25%) patients presented complications related to ventilatory support, skin lesions being the most frequent. Patients with complications related to NIV had higher NIV failure rate (34.6% vs. 23.1%; p=0.028). The HACOR score measured at 1 hour after NIV initiation had an average value of 9.4±4.4 in the NIV failure group and 4.6±2.2 in the success group (p<0.001). The discriminating ability of the HACOR score, at 1 hour after starting NIV, to predict NIV failure showed an area under the curve of 0.863 (95% CI 0.819–0.900) (Figure S1 of Supplementary Material).
Ventilatory settings.
| All(n=300) | NIV success(n=147) | NIV failure(n=153) | p value | |
|---|---|---|---|---|
| Initial ventilatory mode, n (%) | 0.439 | |||
| CPAP | 21 (7) | 12 (8.2) | 9 (5.9) | |
| Bilevel mode | 279 (93) | 135 (91.8) | 144 (94.1) | |
| End ventilation mode, n (%) | 0.376 | |||
| CPAP | 30 (10) | 17 (11.6) | 13 (8.5) | |
| Bilevel | 270 (90) | 130 (88.4) | 140 (91.5) | |
| Ventilator, n (%) | 0.585 | |||
| BiPAP STD® | 30 (10) | 16 (10.9) | 14 (9.2) | |
| BiPAP Vision® | 234 (78) | 111 (75.5) | 123 (80.4) | |
| BiPAP V60® | 36 (12) | 20 813.6) | 16 (10.5) | |
| Interface, n (%) | ||||
| Initial orofacial mask | 298 (99.3) | 146 (99.3) | 152 (99.3) | 0.977 |
| Final orofacial mask | 194 (98) | 145 (98.6) | 149 (97.4) | 0.567 |
| Combinate HFNC, n (%) | 40 (13.3) | 34 (23.1) | 6 (3.9) | <0.001 |
| IPAP, cmH2O | ||||
| Initial | 15±2 | 15±2 | 16±2 | 0.017 |
| Maximum | 18±3 | 17±3 | 19±3 | <0.001 |
| EPAP, cmH2O | ||||
| Initial | 7±1 | 7±1 | 7±1 | 0.836 |
| Maximum | 9±1 | 8±1 | 9±2 | <0.001 |
| FiO2, % | ||||
| Initial | 75±20 | 73±20 | 77±19 | 0.104 |
| Maximum | 83±19 | 77±20 | 89±16 | <0.001 |
| Leakage rate, l/min | ||||
| Mean | 21±8 | 22±8 | 20±8 | 0.184 |
| Minimum | 32±8 | 32±8 | 31±8 | 0.220 |
| NIV duration, hours | 22 (12–38) | 20 (6–36) | 22 (12–39) | 0.004 |
| NIV complications, n (%) | 87 (29) | 34 (23.1) | 53 (34.6) | 0.028 |
| Cutaneous lesion | 67 (22.3) | 27 (18.4) | 40 (26.1) | 0.106 |
| Cutaneous necrosis | 10 (3.3) | 4 (2.7) | 6 (3.9) | 0.750 |
| Eye irritation | 29 (9.7) | 11 (7.5) | 18 (11.8) | 0.210 |
| Claustrophobia | 18 (6) | 7 (4.8) | 11 (7.2) | 0.376 |
| Total intolerance | 8 (2.7) | 1 (0.7) | 7 (4.6) | 0.067 |
| Gastric distension | 9 (3) | – | 9 (5.9) | 0.004 |
| Vomiting | 1 (0.3) | – | 1 (0.7) | >0.999 |
| Pneumothorax | 1 (0.3) | – | 1 (0.7) | >0.999 |
| ACS | 6 (2) | 2 (1.4) | 4 (2.6) | 0.685 |
Quantitative variables are expressed as means±of, or median (interquartile range).
cmH2O: centimeters of water; CPAP: continuous positive airway pressure; EPAP: positive airway expiratory pressure; FiO2: inspiratory oxygen fraction; IPAP: inspiratory positive airway pressure; l/min: liters per minute; NIV: non-invasive ventilation).
Multiple variables were related to NIV failure in multivariate analysis (Figure 2). The independent predictive factors related to greater NIV failure were being initially admitted to the ward (OR=2.39), ACS-AMI as a cause of SC (OR=2.71), SAPS II index (OR=1.04 per point), higher HACOR score at 1 hour after starting NIV (OR=1.44 per point in the score), development of NIV related complication (OR=2.14) and, the most important, the severity of CS (OR=7.26 to D/E stage vs. C stage).
Non-invasive ventilation failure and outcome.")
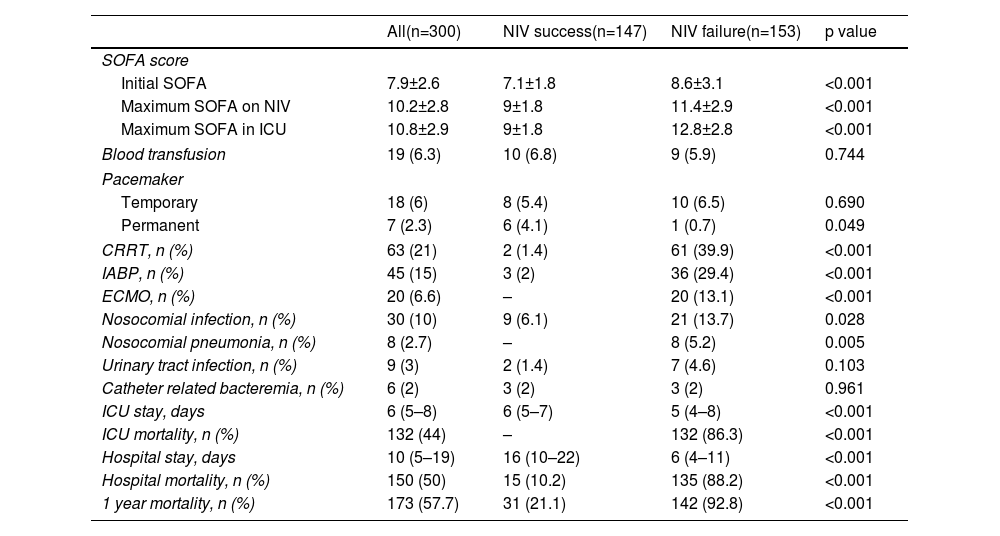
The relation between NIV failure and patient outcome is shown in Table 5 and Table S2. ICU length of stay was longer in patients with NIV success comparing to NIV failure, median 6 days (IQR 5–7) and 5 days (IQR 4–8) respectively (p<0.001), as well as hospital stay, 16 days (IQR 10–22) and 6 days (IQR 4–11) respectively (p<0.001). ICU and hospital mortality was 44% and 50%, respectively. Fifteen patients (10.2%) with NIV success died in the hospital, compared to 135 (88.2%) in NIV failure group (p<0.001). Hospital mortality was related to the severity of CS: it was 10.2% in C stage, 48.9% in D stage and 92.5% in E stage (p<0.001). In patients with NIV failure and need for intubation, there was a longer time between the start of NIV to ETI in those who died in the hospital (Figure 4). Mean duration of NIV use was 22 hours (IQR 6–44) in hospital deceased patients and 6 hours (IQR 3–12) in patients discharged alive (p=0.001).
Patients outcome.
| All(n=300) | NIV success(n=147) | NIV failure(n=153) | p value | |
|---|---|---|---|---|
| SOFA score | ||||
| Initial SOFA | 7.9±2.6 | 7.1±1.8 | 8.6±3.1 | <0.001 |
| Maximum SOFA on NIV | 10.2±2.8 | 9±1.8 | 11.4±2.9 | <0.001 |
| Maximum SOFA in ICU | 10.8±2.9 | 9±1.8 | 12.8±2.8 | <0.001 |
| Blood transfusion | 19 (6.3) | 10 (6.8) | 9 (5.9) | 0.744 |
| Pacemaker | ||||
| Temporary | 18 (6) | 8 (5.4) | 10 (6.5) | 0.690 |
| Permanent | 7 (2.3) | 6 (4.1) | 1 (0.7) | 0.049 |
| CRRT, n (%) | 63 (21) | 2 (1.4) | 61 (39.9) | <0.001 |
| IABP, n (%) | 45 (15) | 3 (2) | 36 (29.4) | <0.001 |
| ECMO, n (%) | 20 (6.6) | – | 20 (13.1) | <0.001 |
| Nosocomial infection, n (%) | 30 (10) | 9 (6.1) | 21 (13.7) | 0.028 |
| Nosocomial pneumonia, n (%) | 8 (2.7) | – | 8 (5.2) | 0.005 |
| Urinary tract infection, n (%) | 9 (3) | 2 (1.4) | 7 (4.6) | 0.103 |
| Catheter related bacteremia, n (%) | 6 (2) | 3 (2) | 3 (2) | 0.961 |
| ICU stay, days | 6 (5–8) | 6 (5–7) | 5 (4–8) | <0.001 |
| ICU mortality, n (%) | 132 (44) | – | 132 (86.3) | <0.001 |
| Hospital stay, days | 10 (5–19) | 16 (10–22) | 6 (4–11) | <0.001 |
| Hospital mortality, n (%) | 150 (50) | 15 (10.2) | 135 (88.2) | <0.001 |
| 1 year mortality, n (%) | 173 (57.7) | 31 (21.1) | 142 (92.8) | <0.001 |
Quantitative variables are expressed as means±of, or median (interquartile range).
CRRT: continuous renal replacement therapy; ECMO: extracorporeal membrane oxygenation; IABP: intra-aortic balloon pump; ICU: intensive care unit; NIV: non-invasive ventilation; SOFA: Sequential Organ Failure Assessment.
In the paired sample using propensity score matching (Table 6), patients in the ETI-IMV group showed a worse prognosis, increased nosocomial infection (OR=2.51, 95% CI=1.33–4.74), ICU mortality (OR=1.75, 95% CI=1.12–2.73), hospital mortality (OR=1.69, 95% CI=1.09–2.63) and 1 year mortality (OR=1.61, 95% CI=1.04–2.51). Only C stage benefited from NIV (hospital mortality 10.1% vs. 32.9%; p<0.001). In patients with E stage, mortality is higher, although without significant differences, in those receiving NIV than ETI-IMV as first respiratory support (Figure 3).
Comparison between CS-NIV and CS-IET. Propensity score matching analysis.
| NIV(n=164) | IET-IMV(n=164) | p value | OR (95% CI) | |
|---|---|---|---|---|
| Admission year, n (%) | ||||
| 1997–2001 | 28 (17.1) | 27 (15.5) | ||
| 2002–2006 | 34 (20.7) | 33 (20.1) | ||
| 2007–2011 | 36 (21.9) | 37 (22.6) | 0.841 | |
| 2012–2016 | 27 (16.5) | 28 (17.1) | ||
| 2017–2021 | 39 (23.8) | 39 (23.8) | ||
| Gender, male, n (%) | 94 (57.3) | 94 (57.3) | >0.999 | |
| Age, years | 73.6±10.3 | 74.2±11.2 | 0.614 | |
| SAPS II | 48.1±14.6 | 49.2±13.7 | 0.482 | |
| Admission from emergency department, n (%) | 100 (61) | 101 (61.6) | >0.999 | |
| CCI | 1 (1–2) | 1 (1–2) | ||
| CS-ACS, n (%) | 87 (53) | 87 (53) | >0.999 | |
| de novo AHF, n (%) | 85 (51.8) | 83 (50.6) | 0.910 | |
| NYHA class III–IV, n (%) | 59 (36) | 62 (37.8) | 0.819 | |
| Previous ischemic cardiomyopathy, n (%) | 78 (47.6) | 82 (50) | 0.740 | |
| Coronary angiography*, n (%) | ||||
| Primary/immediate | 82 (94.2) | 83 (95.4) | >0.999 | |
| Early | ||||
| Delayed | ||||
| Primary revascularization*, n (%) | 37 (42.5) | 49 (56.3) | 0.095 | |
| Fibrinolysis | 1 (1.1) | 3 (3.4) | 0.609 | |
| PCI | 36 (41.4) | 45 (51.7) | 0.226 | |
| Surgery | – | 1 (1.1) | 0.965 | |
| Revascularization during hospital stay*, n (%) | 77 (88.5) | 79 (90.1) | 0.923 | |
| PCI | 74 (85.1) | 77 (88.5) | 0.661 | |
| Surgery | 3 (3.4) | 2 (2.3) | 0.984 | |
| LVEF, % | 30.3±8.5 | 29.6±8.8 | 0.464 | |
| Drugs in ICU | ||||
| Beta-blockers | 43 (26.2) | 45 (27.4) | 0.901 | |
| ACEi/ARB | 44 (26.8) | 41 (25) | 0.801 | |
| Eplerenone | 2 (12.2) | 18 (11) | 0.863 | |
| PaO2/FiO2at ICU admission | 126±31 | 122±41 | 0.319 | |
| Arterial lactate, mmols/L | ||||
| At ICU admission | 4.2±0.9 | 4.3±1.1 | 0.368 | |
| 1 hour after NIV/EIT-IMV | 3.9±0.9 | 4.2±1.5 | 0.029 | |
| CS stage at first 24 hours NIV, n (%) | ||||
| C “Classic” | 79 (48.2) | 85 (51.8) | ||
| D “Deteriorating” | 53 (32.3) | 58 (35.4) | 0.255 | |
| E “Extremis” | 32 (19.5) | 21 (12.8) | ||
| Noradrenaline dose, mcg/kg/min | ||||
| At began NIV/IET-IMV | 0.3±0.1 | 0.3±0.2 | >0.999 | |
| Maximum on the first day | 0.9±0.6 | 1.5±1.1 | <0.001 | |
| SOFA score | ||||
| Initial SOFA | 7.5±2.4 | 7.7±2.6 | 0.469 | |
| Maximum SOFA during ICU stay | 10.3±2.8 | 14.5±3.2 | <0.001 | |
| Nosocomial infection, n (%) | 16 (9.8) | 35 (21.3) | 0.006 | 2.51 (1.33–4.74) |
| Mechanical ventilation length**, hours | 62 (12–79) | 102 (28–192) | <0.001 | |
| ICU stay, days | 4 (2–6) | 7 (3–8) | <0.001 | |
| ICU mortality, n (%) | 56 (34.1) | 78 (47.6) | 0.006 | 1.75 (1.12–2.73) |
| Hospital stay, days | 12 (5–21) | 19 (5–22) | <0.001 | |
| Hospital mortality, n (%) | 59 (36) | 80 (48.8) | 0.025 | 1.69 (1.09–2.63) |
| 1 year mortality, n (%) | 86 (52.4) | 105 (64) | 0.034 | 1.61 (1.04–2.51) |
Quantitative variables are expressed as means±of, or median (interquartile range).
CRRT: continuous renal replacement therapy; ECMO: extracorporeal membrane oxygenation; IABP: intra-aortic balloon pump; ICU: intensive care unit; MCS: mechanical circulatory support; NIV: non-invasive ventilation; SOFA: Sequential Organ Failure Assessment; VAP: ventilator associated pneumonia.

 values of survivors and non-survivors for intubated patients.")
In this study, where a very large population of patients with CS and acute respiratory failure (ARF) treated with NIV were analyzed, NIV success was achieved in 49% of cases. This success rate is similar to that found in a population with acute respiratory distress syndrome or pneumonia, without hemodynamic instability, treated with non-invasive support.32 Traditionally, severe impaired respiratory function in patients with shock has required invasive ventilatory support.30 Shock or multiorgan failure has been considered a contraindication for the use of NIV.34
However, some authors consider it a relative contraindication,8 although patients with CS may be considered suboptimal candidates for this type of respiratory support. Cardiac dysfunction with hypotension, respiratory failure, and tissue hypoperfusion, frequently associated with renal failure33 has been treated with sedation and ETI, in an attempt to minimize oxygen consumption by the respiratory muscles, maximizing the delivery to the diseased myocardium.
In the real world, patients in shock who quickly stabilize with fluid therapy and low dose vasoactive drugs can benefit from NIV.35 The use of NIV has been highly variable in different CS registries, and is used <10% of cases,10–15,17,18 except in a registry of German hospitals between 2005 and 2017, where 12.8% of CS-AIM and 11.6% of CS-non-AMI received NIV.16 Variations according to clinical characteristics have also been observed, with NIV being used more frequently used in CS with preserved rather than reduced LVEF14 and in NSTEMI than in STEMI.11,17,18 Although a French registry showed a decrease in the use of NIV over the years, other registries showed a progressive increase.13,17,18 In addition to registries, some studies have evaluated the use of NIV in CS. Luo et al.,35 in an observational study, analyzed 118 patients with acute pulmonary edema. In that series, 34 patients (28.8%) had Killip class IV HF. NIV failure occurred in 37.2% of the patients with acute pulmonary edema, rising to 56.8% in patients with CS. Hongisto et al.,36 in a sub-analysis of the CardShock study, compared the results of 219 patients in CS: 30 received NIV as the first line of treatment, 133 were intubated and invasively ventilated and 56 received conventional oxygen therapy. There were eight cases of NIV failure (26.6%), four of them in the first 24 hours, and the rest between 24 and 96 hours. The mortality in the NIV group was 19%. Although ARF due to HF with hemodynamic compromise can be treated with NIV, the presence of CS is a risk factor for NIV failure,20,35 as occurs with other ARF etiologies.19,37
Although the success rate of NIV was not as high as in other etiologies of ARF,27,38 the rate of patients with CS receiving IMV in our unit is lower than that reported in other studies,39 partly because the high presence of DNI order, but also because NIV can prevent intubation, especially in less severe patients.
CS is a very heterogeneous pathology, with different prognosis depending on the etiology, severity of the clinical presentation and comorbidities. Recently, a new definition was proposed, describing the stages of this pathology based on presence of hypotension, tachycardia, hypoperfusion, deterioration, and refractory shock.25,28,29 Different phenotypes in CS have also been proposed.40 This can be explained by the clinical differences of the populations analyzed. In the series by Hongisto et al.,36 the main cause of CS was ACS, with a very high percentage (85%) of myocardial revascularization. In our study, patients were older, with a greater number of women, a high percentage of DNI order and a higher number of patients with acute decompensated HF. The physiological characteristics also showed important differences between the two series. In the NIV group by Hongisto et al.,36 the serum lactate level and arterial pH were within the normal range, unlike our patients who showed a lower arterial pH (7.26) and higher serum lactate (4.4 mmol/L). Likewise, the levels of oxygenation of the patients clearly varied between the two groups. The median PaO2/FiO2 ratio was 191 mmHg in the Hongisto series, while in our series it was 124 mmHg. Finally, LVEF differed between the two groups (33% vs. 28%). All these factors may explain why NIV failure and hospital mortality differ so much between the two studies. According to the new cardiogenic shock classification,25,28,29 most of our patients corresponded to stage C and D, while in the Finnish series most patients were in an initial stage of CS. In fact, our series are more similar to the subgroup receiving ETI-IMV in the Finnish study, who had an arterial pH of 7.27, an average lactate level of 3.7 mmol/L and an average PaO2/FiO2 of 141 mmHg, presenting hospital mortality of 47%.36
In patients with hemodynamic instability of cardiac origin and respiratory failure, NIV can improve respiratory parameters which is similar to what occurs in other forms of respiratory failure.19 Clinical and arterial blood gas parameters improved after NIV initiation. This improvement was higher in subjects with NIV success than in those with NIV failure. Patients in whom there was no evidence of an improvement in hemodynamic, respiratory, or neurological parameters were intubated. Treatment with NIV showed few related complications, which were primarily skin lesions derived from the interface, with the most serious complications (like vomiting and total intolerance) being much less frequent. The frequency of complications related to NIV was lower than those observed in the other etiologies of respiratory failure,38 probably in relation to the shorter duration of ventilatory support.
Multiple variables were related to NIV failure. The most important ones were the presence of an advanced stage of CS, ACS-AMI as the cause of CS, the patient being initially admitted to the ward, development of NIV related complication, and higher HACOR score at 1 hour after starting NIV. The classification of CS in severity stages, although it is sometimes difficult to assign patients to CS stages,29 was the most important predictive factor of NIV failure in our series. Patients in D and E stages had more severe multiorgan failure, greater need for organ support, with a higher rate of NIV failure and hospital mortality.
The success of NIV is related to a better prognosis in patients with AHF, similar to patterns in other etiologies of ARF.19,35,38 Patients with NIV success have higher survival rates, while NIV failure is associated with very high mortality. This excessive mortality can be explained by the greater severity of patients in whom NIV fails, but excess mortality cannot be ruled out due to a delay in ETI, which may worsen prognosis. In our series, we found a longer duration of NIV use in patients who presented NIV failure and eventually died, similar to that found in patients with community-acquired pneumonia19 or acute cardiogenic pulmonary edema.35 In a sub-analysis of the TRIUMPH study, conducted in patients with CS, each hour of delay in the initiation of IMV from the time of onset of MI or from the onset of CS was independently associated with increased 30-day mortality in patients with CS.41
Endotracheal intubation and invasive mechanical ventilation present multiple complications. When we compare the paired patients by propensity analysis, at the time respiratory support was started, an aggravation of the patients on IMV was already evident, with a significant increase in serum lactate levels and an increase in the received dose of norepinephrine in the first 24 hours. These alterations may be related to a greater hemodynamic deterioration due to higher increase in intra-thoracic pressure related to IMV.42 The improvement in mortality shown with the use of NIV compared to ETI-IMV, in the propensity analysis, was only present in patients with C stage, while E stages had higher mortality, although not significant, with the use of NIV. These findings, together with the relationship between delayed intubation and increased mortality, suggest that the use of NIV should be restricted to patients in the initial stages of shock, and early intubation should be performed in those whose hemodynamic and respiratory parameters do not improve rapidly. Therefore, the absence of improvement in the HACOR score during NIV could be a valid tool for decision-making in the clinical management of these patients.43
This study has strong points and some limitations. First, at least to our knowledge, it is the largest series of patients with CS treated with NIV. In addition, multiple clinical and evolutionary variables have been prospectively and systematically evaluated to predict NIV failure. The main limitations of this study are determined by its observational nature, which indicates a low level of evidence for the recommendation of the use of NIV in this type of patients. In addition, some variables have had to be reclassified or determined retrospectively (type of ACS or severity of CS) with the difficulty that this implies in some cases. On the other hand, this work was carried out in a department with extensive experience in NIV, so the results found cannot be generalizable to other centers with less experience. The long period of patient recruitment can also be a problem due to changes in the definitions or treatments carried out over the years, but the absence of a relationship between the year of admission and NIV failure minimizes this issue. The study was carried out in the real world, so the decision to proceed to ETI-IMV or to NIV was made by the physician responsible for the patient. This means that if the attending physician considered the situation as being one of greater severity, there was a higher probability of proceeding to ETI-IMV, which could help to explain the poor prognosis of these patients. However, carrying out a paired propensity analysis minimized this bias. Finally, although multiple variables related to heart disease and ventilatory support have been evaluated, we cannot guarantee that any important variables have been ignored.
ConclusionOur study suggests that the effectiveness of NIV in the treatment of acute respiratory failure due to CS is not high. However, in the initial stages, especially in patients with the classic form of shock, it can be safely treated with NIV. The higher severity of patients at admission and during evolution, as well as the non-improvement of respiratory parameters quickly with ventilatory support predicted a worse outcome. NIV can be used in patients with early stages of CS, however, if there is no improvement in hemodynamic and respiratory parameters, early intubation is mandatory.
Conflicts of interestThe authors have no conflicts of interest to declare.
The following are the supplementary data to this article:
