
Ruling out pulmonary embolism (PE) through a combination of clinical assessment and D-dimer level can potentially avoid excessive use of computed tomography pulmonary angiography (CTPA). We aimed to compare the diagnostic accuracy of the standard approach based on the Wells and Geneva scores combined with a standard D-dimer cut-off (500 ng/ml), with three alternative strategies (age-adjusted and the YEARS and PEGeD algorithms) in patients admitted to the emergency department (ED) with suspected PE.
MethodsConsecutive outpatients admitted to the ED who underwent CTPA due to suspected PE were retrospectively assessed. Sensitivity, specificity, positive and negative predictive values, likelihood ratios and diagnostic odds ratios were calculated and compared between the different diagnostic prediction rules.
ResultsWe included 1402 patients (mean age 69±18 years, 54% female), and PE was confirmed in 25%. Compared to the standard approach (p<0.001), an age-adjusted strategy increased specificity with a non-significant decrease in sensitivity only in patients older than 70 years. Compared to the standard and age-adjusted approaches, the YEARS and PEGeD algorithms had the highest specificity across all ages, but were associated with a significant decrease in sensitivity (p<0.001), particularly in patients aged under 60 years (sensitivity of 81% in patients aged between 51 and 60 years).
ConclusionCompared to the standard approach, all algorithms were associated with increased specificity. The age-adjusted strategy was the only one not associated with a significant decrease in sensitivity compared to the standard approach, enabling CTPA requests to be reduced safely.
A exclusão da embolia pulmonar (EP) através da avaliação da probabilidade clínica conjugada com o doseamento dos D-dímeros pode evitar o uso excessivo da tomografia computorizada com angiografia pulmonar (AngioTC pulmonar). Este estudo comparou a perfomance diagnóstica da abordagem clássica (baseada na avaliação da probabilidade pré-teste pelo score de Wells e Geneva combinada com um cut-off de D-dímeros fixo) com três estratégias alternativas (cut-off de D-dímeros ajustado à idade, algoritmo YEARS e PEGeD) em doentes admitidos no Serviço de Urgência (SU) com suspeita de EP.
MétodosForam avaliados retrospetivamente doentes admitidos no SU submetidos a angioTC pulmonar por suspeita de EP. Foi comparada a performance diagnóstica das regras de predição clínica.
ResultadosIncluíram-se 1.402 doentes (idade média 69 ± 18 anos, 54% mulheres), tendo sido a EP confirmada em 25%. Comparativamente com a abordagem clássica (p < 0,001), o uso de um cut-off de D-dímeros ajustado à idade associou-se a aumento da especificidade, com redução não significativa da sensibilidade apenas em doentes com idade superior a 70 anos. A abordagem baseada nos algoritmos YEARS e PEGeD é a que se associa a maior especificidade em todas as idades e a redução significativa da sensibilidade (p < 0,001), particularmente nos doentes com idade inferior a 60 anos (sensibilidade de 81% em doentes com idade entre 51 e 60 anos).
ConclusãoComparativamente com a abordagem clássica, os algoritmos alternativos têm maior especificidade. O uso do cut-off de D-dímeros ajustado à idade é a única estratégia não associada a redução significativa da sensibilidade.
Diagnosis of pulmonary embolism (PE) can be challenging due to its presentation with non-specific signs and symptoms. However, clinicians’ growing awareness about this potentially life-threatening condition and the greater availability of non-invasive imaging tests have significantly improved the diagnostic work-up for this condition in the emergency department (ED).1
Computed tomography pulmonary angiography (CTPA) is the current gold standard for the diagnosis of acute PE. However, CTPA is associated with radiation exposure and contrast-related complications, such as allergy or nephropathy, and is time-consuming, increasing length of stay in the ED. Additionally, a low threshold for CTPA requests could lead to overdiagnosis, increasing the number of subsegmental PE diagnoses of uncertain clinical significance. It is also a costly technique that is not always easily available, particularly in some settings.
The refinement of simple clinical decision rules may improve the diagnostic accuracy of PE in the ED, help to optimize healthcare system sustainability and minimize overuse of CTPA and related complications. In recent years, various diagnostic algorithms have been developed to better select patients for CTPA, such as the use of an age-adjusted D-dimer cut-off and D-dimer cut-offs adapted to clinical probability (the YEARS and PEGeD diagnostic decision algorithms). The European Society of Cardiology guidelines for diagnosis and management of acute PE recommend considering the use of these algorithms as an alternative to a fixed D-dimer cut-off to exclude PE (class IIa recommendation, level of evidence B).2 The three above-mentioned alternative diagnostic decision algorithms were prospectively validated in the ADJUST-PE,3 YEARS4 and PEGeD5 studies, respectively, all of which followed the same methodology and had three main limitations: first, there was no control group, so it was not possible to directly compare the effectiveness and safety of the new proposed clinical decision algorithms with the standard use of a fixed D-dimer cut-off; second, they used a three-month event-free follow-up instead of an imaging test to confirm the absence of PE, which could lead to an overestimation of the diagnostic accuracy of these new algorithms; third, as each D-dimer assay is associated with different sensitivity and specificity, the use of multiple D-dimer assays makes it difficult to compare their results.
ObjectivesThis study aimed to compare the diagnostic accuracy of the standard approach based on the Wells and Geneva scores combined with a fixed D-dimer cut-off of 500 ng/ml with three alternative strategies (age-adjusted D-dimer cut-off and the YEARS and PEGeD algorithms) in patients admitted to the ED. We also aimed to compare the age-dependent diagnostic performance of each strategy.
MethodsThis was a single-center retrospective study conducted at a tertiary university hospital (Centro Hospitalar Universitário Lisboa Norte, Lisbon, Portugal) from April 1, 2019 to January 31, 2021. We selected consecutive adult outpatients admitted to the ED who underwent CTPA due to suspected PE. Demographic, clinical and laboratory data were collected by an investigator blinded to CTPA reports.
Plasma D-dimer levels were measured by a D-dimer assay with a reported cut-off value of 500 ng/ml. Only patients with a D-dimer measurement obtained within 12 hours before CTPA were included.
Patients were excluded if they did not have a D-dimer assay or if the CTPA was inconclusive. Furthermore, considering that part of the study was carried out during the COVID-19 pandemic, patients diagnosed with COVID-19 were excluded, given the known impact of SARS-CoV-2 infection on D-dimer levels.6
Due to the retrospective analysis of data, the need for informed consent was waived.
Computed tomography protocolComputed tomography (CT) scans were obtained with a 16-slice multidetector system (Siemens®) after intravenous injection of 60–90 ml of iodinated contrast agent. The CTPA scans were interpreted by the attending radiologist and reviewed at the time of inclusion in the study by a second radiologist, who was blinded to the clinical information.
Diagnosis of pulmonary embolism was based on filling defects of the pulmonary artery on at least two consecutive axial sections. In addition, PE was classified according to the location of the thrombus and the presence of right heart strain (defined as right/left ventricular diameter ratio >1 or interventricular septal bowing).
Assessment of scores and algorithmsThe items comprising the diagnostic prediction rules were calculated post hoc by the authors based on data from clinical records at the time of the CTPA request, blinded to the CT reports. If there was no documentation for a component of any score, it was considered absent.
The Wells score ranges from 0 to 12.5 points, based on the following criteria: signs and symptoms of deep vein thrombosis (3 points), PE as the first or equally likely diagnosis (3 points), previous objectively diagnosed PE or deep vein thrombosis (1.5 points), heart rate >100 beats per minute (bpm) (1.5 points), immobilization for at least three days or surgery in the previous four weeks (1.5 points), malignancy with treatment within six months or palliative (1 point), and hemoptysis (1 point).7 PE was considered equally likely based on the attendant physician's impression recorded in the medical chart. Patients were categorized as having low (<4.0 points), moderate (4.5–6.0 points) or high (≥6.5 points) pretest probability of PE.
The revised Geneva score assesses the following: previous objectively diagnosed PE or deep vein thrombosis (3 points), unilateral lower limb pain (3 points), heart rate >95 or between 75 and 94 bpm (5 or 3 points, respectively), active cancer (2 points), hemoptysis (2 points), age >65 years (1 point), surgery or fracture within one month (2 points) and pain on limb palpation and unilateral edema (4 points).7 Patients are categorized as having low (0–3 points), moderate (4–10 points) or high (≥11 points) clinical probability of PE.
In the standard approach, patients classified as having high clinical probability on the Wells or Geneva scores are directly selected to undergo CTPA, while patients with low to moderate clinical probability only undergo CTPA if they have a D-dimer level above 500 ng/ml. The age-adjusted approach applies the same criteria, but the D-dimer cut-off level to select patients with low to moderate probability to undergo CTPA is found by multiplying the patient's age by 10 in patients aged over 50 years.3
The YEARS algorithm consists of three clinical items: signs of deep vein thrombosis, hemoptysis, and whether PE is the most likely diagnosis.4 PE is excluded in patients with no YEARS items and a D-dimer level <1000 ng/ml, or in patients with one or more YEARS items and D-dimer <500 ng/ml. All other patients undergo CTPA.
In the PEGeD algorithm, PE is ruled out in patients with low pretest probability and a D-dimer level of <1000 ng/ml or with a moderate pretest probability and a D-dimer level of <500 ng/ml.5 All other patients, including those with high clinical probability, should undergo CTPA. In this algorithm, the clinical pretest probability is based on the Wells score described above.
Statistical analysisCategorical variables were presented as frequency rates or percentages and continuous variables as medians with interquartile range. Categorical and continuous variables were compared using Pearson's chi-square and Mann–Whitney tests, respectively. Sensitivity, specificity, positive and negative predictive values, likelihood ratios and diagnostic odds ratios were calculated and compared between the different diagnostic prediction rules.
Statistical significance was defined as a p-value <0.05, except for comparisons of the diagnostic prediction rules, in which the Bonferroni procedure was used to account for the 15 multiple comparisons, with a p-value of 0.003 or less considered to indicate statistical significance. The statistical software used to analyze the data was IBM SPSS® v.26 (IBM).
ResultsA total of 1827 CTPAs were performed due to suspected PE during the study period. After application of the exclusion criteria, 1402 were included in the final analysis. The study flowchart is summarized in Figure 1.

Overall, the mean age of the study population was 69±18.32 years, and 54% were female. CTPA confirmed PE in 353 patients (25%). The vascular location of emboli showed a predominantly central distribution (72%), affecting the main and lobar arteries (33% and 39%, respectively). Bilateral involvement was documented in 49% of patients, and 15% had evidence of right heart strain.
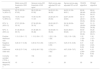
Table 1 illustrates the accuracy of the different diagnostic prediction rules for PE.
Diagnostic accuracy of the Wells and Geneva scores combined with fixed and age-adjusted cut-offs and the YEARS and PEGeD algorithms to predict pulmonary embolism.
| Wells score+DD threshold of 500 ng/ml | Geneva score+DD threshold of 500 ng/ml | Wells score+age-adjusted DD cut-off | Geneva score+age-adjusted DD cut-off | YEARS algorithm | PEGeD algorithm | |
|---|---|---|---|---|---|---|
| Sensitivity, % (95% CI) | 95.75 (93.09–97.60) | 96.03 (93.44–97.82) | 94.05 (91.05–96.28) | 94.33 (91.39–96.51) | 90.08 (86.48–93.00) | 89.24 (85.52–92.27) |
| Specificity, % (95% CI) | 15.35 (13.22–17.67) | 15.06 (12.95–17.37) | 23.26 (20.73–25.94) | 22.97 (20.46–25.64) | 32.13 (29.31–35.05) | 33.56 (30.70–36.50) |
| PPV, % (95% CI) | 27.57 (25.08–30.16) | 27.56 (25.08–30.15) | 29.20 (26.57–31.94) | 29.18 (26.56–31.92) | 30.87 (28.06–33.80) | 31.13 (28.28–34.08) |
| NPV, % (95% CI) | 91.48 (86.33–95.15) | 91.86 (86.72–95.48) | 92.08 (88.14–95.03) | 92.34 (88.41–95.26) | 90.59 (87.16–93.36) | 90.26 (86.87–93.01) |
| Positive likelihood ratio | 1.13 (1.09–1.17) | 1.13 (1.09–1.17) | 1.23 (1.18–1.28) | 1.22 (1.18–1.28) | 1.33 (1.26–1.49) | 1.34 (1.27–1.42) |
| Negative likelihood ratio | 0.28 (0.17–0.46) | 0.26 (0.15–0.45) | 0.26 (0.17–0.39) | 0.25 (0.16–0.38) | 0.31 (0.22–0.43) | 0.32 (0.23–0.44) |
| Likelihood odds ratio | 4.09 (2.37–7.04) | 4.29 (2.45–7.52) | 4.79 (3.01–7.62) | 4.97 (3.09–7.97) | 4.30 (2.96–6.24) | 4.19 (2.92–6.00) |
| Correctly avoided CTPA, n | 161 | 158 | 244 | 241 | 337 | 352 |
| Missed PE diagnosis, n | 15 | 14 | 21 | 20 | 35 | 38 |
CI: confidence interval; CTPA: computed tomography pulmonary angiography; DD: D-dimer; NPV: negative predictive value; PPV: positive predictive value.
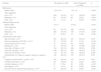
Patient stratification according to clinical probability and the prevalence of risk factors for venous thromboembolism (VTE) in patients with or without PE is represented in Table 2. According to the Wells score, 1234 patients (88%) had low clinical probability, 134 (10%) had intermediate probability, and 34 (2%) had high clinical probability. The prevalence of PE was 21%, 49% and 74%, respectively, in these three probability groups. Regarding the Geneva score, 332 (24%), 1030 (73%) and 40 (3%) were stratified as low, intermediate and high clinical probability, and the prevalence of PE was 16%, 27% and 53%, respectively. Both the Wells and Geneva scores were significantly higher in patients with than without PE (p<0.001). There was no difference in sensitivity or specificity between the Wells and Geneva scores, regardless of whether it considered a fixed (p=0.317 for both) or an age-adjusted D-dimer cut-off (p=0.250 and p=0.375, respectively).
Risk assessment for pulmonary embolism according to the Wells and Geneva scores and YEARS items and prevalence of each risk factor.
| Variable | PE patients (n=353) | Non-PE patients (n=1049) | p | ||
|---|---|---|---|---|---|
| Wells score | |||||
| Median (IQR) | 1.5 (0–4.5) | 1 (0–1.5) | <0.001 | ||
| Risk categories | |||||
| Low, n (%) | 263 | (74.5%) | 971 | (92.6%) | <0.001 |
| Moderate, n (%) | 65 | (18.4%) | 69 | (6.6%) | <0.001 |
| High, n (%) | 25 | (7.1%) | 9 | (0.9%) | <0.001 |
| Revised Geneva score | |||||
| Median (IQR) | 5 (4–7) | 4 (3–6) | <0.001 | ||
| Risk categories | |||||
| Low, n (%) | 52 | (14.7%) | 280 | (26.7%) | <0.001 |
| Moderate, n (%) | 280 | (79.3%) | 750 | (71.5%) | <0.001 |
| High, n (%) | 21 | (5.9%) | 19 | (1.8%) | <0.001 |
| Components of the scores | |||||
| Age >65 years, n (%)a | 227 | (64.3%) | 675 | (64.4%) | 0.972 |
| Previous diagnosis of DVT/PE, n (%)a,b | 37 | (10.5%) | 53 | (5.1%) | <0.001 |
| Clinical signs of DVT, n (%)b,c | 37 | (10.5%) | 38 | (3.6%) | <0.001 |
| Malignancy, n (%)b | 77 | (21.8%) | 176 | (16.8%) | 0.034 |
| Heart rate >100 bpm, n (%)b | 152 | (43.1%) | 369 | (35.2%) | 0.009 |
| Heart rate >95 bpm, n (%)a | 198 | (56.1%) | 487 | (46.4%) | 0.015 |
| Heart rate 75–94 bpm, n (%)a | 112 | (31.7%) | 336 | (32.0%) | 0.908 |
| Immobilization for 3 days or surgery in previous 4 weeks, n (%)a | 100 | (28.3%) | 210 | (20.1%) | 0.001 |
| Surgery or fracture within 1 month, n (%)b | 100 | (28.3%) | 210 | (20.1%) | 0.001 |
| Unilateral leg edema, n (%)a | 38 | (10.8%) | 44 | (4.2%) | <0.001 |
| Unilateral leg pain, n (%)a | 27 | (7.6%) | 29 | (2.8%) | <0.001 |
| Hemoptysis, n (%)b,c | 11 | (3.1%) | 30 | (2.9%) | 0.809 |
| PE as the first or equally likely diagnosis, n (%)b,c | 93 | (26.3%) | 92 | (8.8%) | <0.001 |
bpm: beats per minute; DVT: deep vein thrombosis; IQR: interquartile range; PE: pulmonary embolism.
The standard approach based on the Wells or Geneva score combined with a fixed D-dimer cut-off of 500 ng/ml displayed a higher sensitivity than the use of an age-adjusted cut-off, although this was not statistically significant (p=0.014 for both). Although the decrease in sensitivity was not statistically significant, using an age-adjusted cut-off was associated with six more missed PE diagnoses if the Wells score was used to assess clinical probability and five more missed PE diagnoses if the Geneva score was used. Regarding specificity, the use of an age-adjusted D-dimer cut-off resulted in a substantial increase in specificity compared to the standard D-dimer cut-off of 500 ng/ml (p<0.001) for both the Wells and Geneva scores.
YEARS algorithmThe YEARS algorithm had significantly higher specificity and lower sensitivity than a D-dimer cut-off of 500 ng/ml, whether fixed or age-adjusted, and whether the Wells or Geneva score was used to assess pretest clinical probability (p<0.001 for all). There was no significant difference in sensitivity between the YEARS and PEGeD algorithms (p=0.083), although the YEARS algorithm demonstrated lower specificity (p<0.001). The YEARS algorithm enabled a reduction of CTPA requests in 14% and 8% compared to the standard and age-adjusted approaches, respectively.
Of the 35 patients in whom the YEARS strategy would have missed a PE diagnosis, 16 (45.7%) had a D-dimer level above their age-adjusted cut-off but lower than 1000 ng/ml.
PEGeD algorithmThe PEGeD algorithm had significantly lower sensitivity than the other diagnostic prediction rules considered (p<0.001), except for the YEARS algorithm (p=0.083). The PEGeD algorithm was associated with 23 and 24 more missed PE diagnoses than the standard approach based on a fixed D-dimer cut-off combined with the Wells and Geneva scores, respectively. The PEGeD algorithm had the highest specificity of all diagnostic prediction rules (p<0.001 for all).
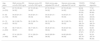
Performance of the diagnostic prediction rules according to ageOf the 353 patients with PE, 286 (81%) were aged over 50 years (with a pooled incidence of 10.5%, 14.7%, 22.9% and 32.9% in patients aged 51–60 years, 61–70 years, 71–80 years and over 80 years, respectively). The sensitivity and specificity of all diagnostic prediction rules for all ages ranges are represented in Tables 3 and 4, respectively.
Sensitivity (%, 95% confidence interval) of the different diagnostic prediction rules grouped by age.
| Age, years | Wells score+DD cut-off of 500 ng/ml | Geneva score+DD cut-off of 500 ng/ml | Wells score+age-adjusted DD cut-off | Geneva score+age-adjusted DD cut-off | YEARS algorithm | PEGeD algorithm |
|---|---|---|---|---|---|---|
| ≤50 (n=233) | 87.72 (76.32–94.92) | 87.72 (76.32–94.92) | 87.72 (76.32–94.92) | 87.72 (76.32–94.92) | 82.09 (70.80–90.39) | 77.61 (65.78–86.89) |
| 51–60 (n=153) | 94.59 (81.81–99.34) | 94.59 (81.81–99.34) | 94.59 (81.81–99.34) | 94.59 (81.81–99.34) | 81.08 (64.84–92.04) | 81.08 (64.84–92.04) |
| 61–70 (n=227) | 96.15 (86.79–99.53) | 96.15 (86.79–99.53) | 96.15 (86.79–99.53) | 96.15 (86.79–99.53) | 96.15 (86.79–99.53) | 96.15 (86.79–99.53) |
| 71–80 (n=323) | 98.77 (93.31–99.97) | 98.77 (93.31–99.97) | 95.06 (87.84–98.64) | 95.06 (87.84–98.64) | 93.83 (86.18–97.97) | 93.83 (86.18–97.97) |
| >80 (n=466) | 97.41 (92.63–99.46) | 97.41 (92.63–99.46) | 94.83 (89.08–98.08) | 94.83 (89.08–98.08) | 92.24 (85.78–96.39) | 92.24 (85.78–96.39) |
DD: D-dimer.
Specificity (%, 95% confidence interval) of the different diagnostic prediction rules grouped by age.
| Age, years | Wells score+DD cut-off of 500 ng/ml | Geneva score+DD cut-off of 500 ng/ml | Wells score+age-adjusted DD cut-off | Geneva score+age-adjusted DD cut-off | YEARS algorithm | PEGeD algorithm |
|---|---|---|---|---|---|---|
| ≤50 (n=233) | 30.12 (23.25–37.71) | 30.12 (23.25–37.71) | 30.12 (23.25–37.71) | 30.12 (23.25–37.71) | 50.60 (42.75–58.44) | 52.41 (44.53–60.20) |
| 51–60 (n=153) | 22.41 (15.19–31.09) | 22.41 (15.19–31.09) | 29.31 (21.23–38.48) | 29.31 (21.23–38.48) | 44.83 (35.59–54.34) | 45.69 (36.41–55.19) |
| 61–70 (n=227) | 17.14 (11.88–23.56) | 16.57 (11.39–22.92) | 29.14 (22.53–36.48) | 28.57 (22.01–35.88) | 37.71 (30.51–45.34) | 40.00 (32.68–47.66) |
| 71–80 (n=323) | 10.74 (7.14–15.34) | 9.92 (6.46–14.40) | 20.66 (15.74–26.32) | 19.83 (15.00–25.42) | 26.45 (21.00–32.48) | 28.51 (22.91–34.65) |
| >80 (n=466) | 8.29 (5.62–11.68) | 8.29 (5.62–11.68) | 16.68 (13.09–21.20) | 16.68 (13.09–21.20) | 20.29 (16.20–24.89) | 20.86 (16.72–25.50) |
DD: D-dimer.
For all the diagnostic prediction rules, specificity decreased with age. In patients aged over 80 years, the specificity of the standard approach based on a fixed D-dimer cut-off of 500 ng/ml combined with the Wells or Geneva scores could be as low as 8%.
Compared to the standard approach, the age-adjusted strategy was associated with higher specificity in all ages over 50 years (p=0.008 for patients aged 51–60 years and p<0.001 for patients aged over 60 years), with similar sensitivity for patients aged under 70 years (p=1.0) and a non-statistically significant decrease in sensitivity in patients older than 70 years (p=0.03).
Using an age-adjusted strategy combined with the Wells score in patients aged over 70 years (n=788) would have excluded PE in an additional 60 patients without further testing (representing an increase from 7.5% to 15%), although associated with an additional six missed PE diagnoses (four of them with subsegmental involvement).
The YEARS and PEGeD algorithms had the highest specificity for all ages (p≤0.001), ranging from 20% and 21% in patients aged over 80 years to 51% and 52% in patients aged ≤50 years, respectively. Regarding sensitivity, except for patients aged between 61 and 70 years, the YEARS and PEGeD algorithms showed lower sensitivity than the standard and age-adjusted approaches for all ages (p<0.001), particularly in patients aged under 60 years.
DiscussionThis study aimed to compare the performance of four diagnostic prediction rules for PE in patients admitted to the ED. To the best of our knowledge, our study is the first to simultaneously compare the standard diagnostic approach based on the Wells and Geneva scores combined with a fixed D-dimer cut-off and the three alternative diagnostic strategies proposed in the guidelines – age-adjusted and the YEARS and PEGeD algorithms. Furthermore, it was pertinent to evaluate the individual performance of each score, since they have been validated in studies (ADJUST-PE,3 YEARS4 and PEGeD5) but with significant limitations: the absence of a control group, preventing direct comparison of these strategies with the standard approach; and the use of a three-month event-free follow-up instead of an imaging test to confirm the absence of PE, which could lead to overestimation of the diagnostic accuracy of these newly proposed algorithms. Patients not selected to undergo CTPA were left untreated and followed for three months – if they did not show symptoms of VTE, the diagnosis was excluded. However, PE can present with a subclinical course or even with few and non-specific symptoms. Additionally, due to natural fibrinolysis, symptoms can improve with time even without treatment. This may have contributed to possible misclassification as symptomatic/asymptomatic during the follow-up of these studies. This is of particular interest considering that a missed PE diagnosis and the absence of anticoagulant therapy can lead to various complications including chronic thromboembolic pulmonary hypertension.8,9 Thus, although these trials concluded that the new algorithms were safe, the methodology applied can only guarantee that they are safe for excluding PE with significant clinical repercussion during follow-up.
The incidence of PE in our cohort of patients undergoing CTPA was 25%, comparable to that observed in previously published studies.10,11
The incidence of VTE increases exponentially with age, particularly after the age of 60,12 which was confirmed by our results, with more than 80% of PE cases occurring in patients aged over 50 years. Accurate and prompt diagnosis in older patients is crucial but simultaneously challenging, for multiple reasons. First of all, aging is associated with an increased prevalence of cardiac and pulmonary comorbidities, which may mimic the non-specific symptoms arising from PE.13 Second, as D-dimer levels increase physiologically with age, this triage test is likely to be less specific in older patients, hindering the ability to exclude PE in older patients and leading to a greater number of additional diagnostic tests.12,14 Our results also align with this, since tests of all the diagnostic prediction rules revealed a marked decrease in specificity with age.
Overall, the age-adjusted strategy was associated with lower sensitivity than the standard approach. Although this was not statistically significant, it resulted in six more missed PE diagnoses. The age-adjusted approach resulted in a significant increase in specificity for both the Wells and Geneva scores, compared to the fixed D-dimer cut-off. The ADJUST-PE study found that using an age-adjusted cut-off would reduce use of imaging exams from 71.8% to 60.2% compared to the standard D-dimer cut-off, similar to what has been demonstrated in systematic reviews and meta-analyses.3,15,16 In our cohort, the magnitude of the overall benefit from an age-adjusted strategy was lower, with a 6.4% reduction in CTPA requests.
In a cohort of 1029 patients, Righini et al. demonstrated that age affects the performance of diagnostic tests for PE, documenting a specificity as low as 10% in patients aged over 80 years.12 We also found a specificity as low as 8% with the standard approach based on the Wells or Geneva scores combined with a fixed D-dimer cut-off of 500 ng/ml. Thus, elderly patients may derive the greatest potential benefit from the use of an age-adjusted cut-off. In the ADJUST-PE study, an age-adjusted approach (instead of the standard D-dimer cut-off of 500 ng/ml) increased the number of patients in whom PE could be excluded from 6.4% to 29.7%, without additional false negatives, in patients aged over 75 years.3 Current guidelines advise considering the use of an age-adjusted cut-off in patients aged over 50 years, but no further specific recommendations are provided on the diagnostic management of very old patients.2 In our cohort the age-adjusted approach, although associated with a decrease in specificity with age, performed better than the fixed D-dimer cut-off for the whole spectrum of ages. Compared to a fixed D-dimer cut-off, the age-adjusted approach was associated with a non-significant decrease in sensitivity only in patients over the age of 70 years.
Using an age-adjusted strategy combined with pretest clinical probability assessed by the Wells score, instead of a fixed D-dimer cut-off, in patients aged over 70 years, we reported an increase from 7.5% to 15% in the proportion of patients in whom PE could be excluded without further testing, avoiding the potential harm related to radiation exposure and contrast-induced nephropathy. On the other hand, the age-adjusted approach in this patient subgroup was associated with six additional missed PE diagnoses (four of them with subsegmental involvement), and all without the presence of right heart strain.
Despite the decrease in sensitivity, considering the documented incidence of contrast-induced nephropathy (which may be as high as 14%) and its established association with severe renal failure and death,17 the risk–benefit balance may still favor the use of an age-adjusted strategy in this patient subgroup.
The YEARS algorithm was introduced as a simple and rapid screening test to predict the probability of PE.4 Its safety and efficiency were prospectively validated in a cohort of 3465 patients, and its main advantage was a 14% absolute reduction in CTPA requests.4 However, out of 2946 patients excluded for PE by the YEARS criteria, 18 developed VTE. Six of those patients died, in whom PE could not be excluded as the cause of death. Thus, it was crucial to compare the performance of the YEARS algorithm with the other diagnostic prediction rules.
When applied to our cohort, the YEARS algorithm presented a significantly higher specificity and lower sensitivity than the standard and age-adjusted approaches. Although the YEARS algorithm led to 14% and 8% reductions in CTPA requests compared to the standard and age-adjusted approaches, respectively, it was also associated with a significant increase in missed PE diagnoses. We found no significant difference in sensitivity between the YEARS and PEGeD algorithms, although the YEARS algorithm demonstrated lower specificity.
Eddy et al. compared the accuracy of the YEARS algorithm with an age-adjusted approach. They demonstrated that all of the 17 patients in whom a PE diagnosis would have been missed by the YEARS strategy had D-dimer levels above their age-adjusted cut-off but less than 1000 ng/ml, and recommended caution in the use of the algorithm in patients with no YEARS items and D-dimer <1000 ng/ml but above the patient's age-adjusted cut-off.18 Of note, the prevalence of PE in this patient subgroup was not reported in the YEARS study. In our cohort, considering the 35 patients in whom PE was excluded without an imaging test, 16 patients (45.7%) had D-dimer levels above their age-adjusted cut-off, reinforcing the need for care in the use of this algorithm in these patients.
The YEARS and PEGeD algorithms specify a D-dimer cut-off of 1000 ng/ml in the case of no YEARS items and low clinical probability, respectively, which would only be reached in a 100-year-old patient when using an age-adjusted cut-off. No subgroup analysis was performed for very elderly patients (aged >75 years) in the YEARS study.4 In our analysis, both the YEARS and PEGeD algorithms performed better in patients aged over 60 years, in whom they maintained reasonable sensitivity (92–96%) with the highest specificity of all the diagnostic prediction rules (20% and 21%, respectively). Between the ages of 61 and 70 years, both the YEARS and PEGeD algorithms were shown to be the better strategy to select patients for CTPA, as their sensitivity was as high as the standard and age-adjusted approaches (96%), but their specificity was still the highest of all the prediction rules (38% and 40% for YEARS and PEGeD, respectively). Thus, the YEARS and PEGeD algorithms could be useful to limit the use of CTPAs in elderly patients, who are more prone to develop contrast-induced complications.19 On the other hand, the YEARS and PEGeD algorithms showed unacceptable sensitivity for a triage test in patients aged under 60 years (78% for patients under the age of 50, and 81% for those aged between 51 and 60 years), despite having the highest specificity of all the clinical prediction rules in this age range.
Considering that none of the currently available strategies perfectly fits the desired high sensitivity and specificity, alternative approaches have been studied to optimize diagnostic work-up for ruling out PE. A recent systematic review and meta-analysis demonstrated that the safety and efficiency of the clinical prediction rules to rule out PE may differ depending on the healthcare setting, with higher failure rates observed in hospitalized patients than in primary healthcare.22 Inpatient status was included in a recently proposed prediction model for selecting patients for CTPA based on patient data meta-analysis.20 In addition to inpatient status, this model included variables commonly used in the Wells and Geneva scores (such as age, gender, previous VTE, recent surgery or immobilization, hemoptysis, cancer, and clinical signs of deep vein thrombosis) combined with D-dimer and an interaction term between age and D-dimer. This model demonstrated a pooled c-statistic of 0.87 (95% confidence interval [CI] 0.85–0.89), surpassing the discriminative power of the Wells score combined with a D-dimer threshold based on age (c-statistic 0.73, 95% CI 0.70–0.75).20 In addition, a recent study published by our group developed and validated a deep learning-based artificial intelligence (AI) model for predicting PE using a 12-lead electrocardiogram. In this study, the AI model showed a specificity of 100% (95% CI: 94–100), highlighting the potential use of new tools based on AI to overcome one of the major limitations (low specificity) of the use of standard diagnostic prediction rules, such as the Geneva and Wells scores.21 Although the sensitivity of this model was also relatively low (50%), this study demonstrated the potential benefit of combining AI and clinical prediction rules to overcome current diagnostic limitations.
To this end, future studies may include new variables and combined methods to determine the optimum diagnostic strategies for ruling out PE.
LimitationsOur study benefits from applying all diagnostic prediction rules to the same patients, all of whom underwent CTPA and came from a relatively large sample. However, some limitations should be considered. First, this was a retrospective single-center chart review study. Second, our case-finding process started from a review of all patients undergoing CTPA due to suspected PE. Thus, the study did not include patients who did not undergo CTPA due to contraindications or low pretest clinical probability and normal D-dimer levels. Third, patients were included if CTPA was performed due to suspected PE in the ED, limiting our ability to conclude whether these results can be applied in other clinical scenarios.
ConclusionOur study found that an age-adjusted D-dimer cut-off increases specificity compared to the standard approach based on a D-dimer cut-off of 500 ng/ml, with a non-significant decrease in sensitivity. This corroborates current guidelines and supports the use of D-dimer testing with an age-adjusted cut-off to better select patients, particularly the elderly, to undergo CTPA and minimize contrast-related complications.2 The YEARS and PEGeD algorithms, although the most specific of all the diagnostic prediction rules for the entire age spectrum, were associated with a significant decrease in sensitivity, particularly in those under the age of 60 years, in whom sensitivity was unacceptably low for their use as a triage test.
Although these results should be prospectively validated in the future, for the time being they add relevant data to the body of evidence currently available in the field and may be useful in everyday clinical practice.
FundingThis research did not receive any specific grant from funding agencies in the public, commercial, or not-for-profit sectors.
Conflicts of interestThe authors have no conflicts of interest to declare.
