


Pulmonary endarterectomy should be considered in all patients with chronic thromboembolic pulmonary hypertension. Twenty five percent of patients maintain pulmonary hypertension after pulmonary endarterectomy, with therapeutic and prognostic implications. We aimed to evaluate echocardiographic parameters at diagnosis as predictors for development of residual pulmonary hypertension.
MethodsRetrospective, observational, unicentric study of patients with confirmed chronic thromboembolic pulmonary hypertension who underwent pulmonary endarterectomy between January 2010 and October 2024. All patients underwent transthoracic echocardiogram at diagnosis. After pulmonary endarterectomy, patients had a right heart catheterization to exclude residual pulmonary hypertension (mean pulmonary artery pressure ≥30 mmHg). Right heart echocardiographic parameters were assessed and compared.
ResultsThirty-nine patients had chronic thromboembolic pulmonary hypertension and underwent pulmonary endarterectomy during the follow-up period. Mean age at diagnosis was 57.3 years-old. Eighteen patients had documented residual pulmonary hypertension. Tricuspid annular plane systolic excursion (p=0.010), end-diastolic right ventricular area (p<0.001), end-systolic right ventricular area (p<0.001), fractional area change (p=0.006), tricuspid annular plane systolic excursion/pulmonary artery systolic pressure ratio (p=0.002), diastolic (p=0.002) and systolic eccentric ratio (p=0.036) were significantly different between the two groups. End-systolic right ventricular area and end-diastolic right ventricular area were independently associated with residual pulmonary hypertension (p=0.023 and p=0.013), and those with end-diastolic right ventricular area above 27.13 cm2 (area under the curve [AUC] 0.88, sensitivity 89%, specificity 85%, odds ratio 44) and end-systolic right ventricular area >19.54 cm2 (AUC 0.875, sensitivity 88%, specificity 85%, odds ratio 38.5) had higher probability of developing residual pulmonary hypertension after pulmonary endarterectomy.
ConclusionThis study shows that certain echocardiographic parameters could be predictors of development of residual pulmonary hypertension after pulmonary endarterectomy; however, validation in larger cohorts is mandatory.
A endarterectomia pulmonar deve ser considerada em todos os doentes com hipertensão pulmonar tromboembólica crónica. No entanto, 25% dos doentes mantêm hipertensão pulmonar após a endarterectomia pulmonar, com implicações terapêuticas e prognósticas. O nosso objetivo foi avaliar parâmetros ecocardiográficos no diagnóstico como preditores do desenvolvimento de hipertensão pulmonar residual.
MétodosEstudo retrospetivo, observacional e unicêntrico de doentes com diagnóstico confirmado de hipertensão pulmonar tromboembólica crónica submetidos a endarterectomia pulmonar entre janeiro de 2010 e outubro de 2024. Todos os doentes realizaram ecocardiograma transtorácico no momento do diagnóstico. Após a endarterectomia pulmonar, os doentes foram submetidos a cateterismo direito para exclusão de hipertensão pulmonar residual (pressão média da artéria pulmonar ≥30mmHg). Os parâmetros ecocardiográficos do coração direito foram analisados e comparados.
ResultadosTrinta e nove doentes com hipertensão pulmonar tromboembólica crónica foram submetidos a endarterectomia pulmonar durante o período de seguimento. A idade média ao diagnóstico foi de 57,3 anos. Dezoito doentes apresentaram hipertensão pulmonar residual documentada. A excursão sistólica do plano anular tricúspide (p=0,010), área tele-diastólica do ventrículo direito (p < 0,001), área tele-sistólica do ventrículo direito (p < 0,001), variação fracional da área (p=0,006), a razão TAPSE/pressão sistólica da artéria pulmonar (p=0,002), e índices de excentricidade diastólico (p=0,002) e sistólico (p=0,036) foram significativamente diferentes entre os dois grupos. A área tele-sistólica e a área tele-diastólica do ventrículo direito estavam independentemente associadas à hipertensão pulmonar residual (p=0,023 e p=0,013, respetivamente), sendo que os doentes com área tele-diastólica do ventrículo direito superior a 27,13cm2 (AUC 0,88, sensibilidade 89%, especificidade 85%, razão de probabilidades 44) e área tele-sistólica do ventrículo direito superior a 19,54cm2 (AUC 0,875, sensibilidade 88%, especificidade 85%, razão de probabilidades 38,5) apresentaram maior probabilidade de desenvolver hipertensão pulmonar residual após a endarterectomia pulmonar.
ConclusãoEste estudo demonstra que determinados parâmetros ecocardiográficos podem ser preditores do desenvolvimento de hipertensão pulmonar residual após endarterectomia pulmonar, contudo é essencial a validação em coortes de maior dimensão.

Chronic thromboembolic pulmonary hypertension (CTEPH) is defined by the presence of symptoms – dyspnea, tiredness, and edema – associated with thrombotic and fibrotic occlusions within the pulmonary arteries and its branches. These cause ventilation/perfusion (V/Q) mismatches in V/Q scintigraphy or documented by computed tomography with confirmed pulmonary hypertension by right heart catheterization (RHC), after three months of effective anticoagulation.1,2 CTEPH can arise after an acute episode of pulmonary embolism (PE) or the symptoms can evolve for months or even years before diagnosis.3,4
This condition is associated with high morbidity,3,5 but mortality in recent years has been declining.6 Unlike pulmonary arterial hypertension, CTEPH is curable. Surgical removal of the lesions by pulmonary endarterectomy (PEA) should be considered in patients with proximal and segmental lesions. Historically, PEA has had high rates of mortality and morbidity,7 but over the past 10 years, the rate has been declining. High-volume centers have reported rates <2%.8
Unfortunately, it is estimated that 25% of patients experience recurrence or persistence of PH, defined as residual PH,9 which has a therapeutic and prognostic impact.10 So far, no specific criteria for residual PH have been defined. Cannon et al. demonstrated that mPAP ≥38 mmHg and pulmonary vascular resistance (PVR) ≥5.3 Wood units (W/U) were associated with long-term survival, and that mPAP ≥30 mmHg was associated with vasodilator initiation due to clinical worsening.11
Even though there are risk scores to predict the development of CTEPH when there is suspicion,12 to date, no scores or clinical, laboratory or echocardiographic criteria have been associated with the development of residual PH after PEA.
ObjectivesWe sought to evaluate various echocardiographic parameters that could be used as predictors of development of residual PH in patients with CTEPH diagnosis who had undergone PEA.
MethodsStudy populationWe performed a retrospective, observational, unicentric study of patients with confirmed diagnosis of CTEPH who underwent PEA, between January 2010 and October 2024 at a nationwide PH referral center. All patients had undergone transthoracic echocardiogram at least three months after effective anticoagulation, either after a prior episode of PE or documented V/Q mismatch in scintigraphy or documented thrombotic or fibrotic lesions within the pulmonary arteries and their branches. RHC was performed in all patients after echo to confirm the CTEPH diagnosis.
After CTEPH diagnosis, the multidisciplinary team, including cardiothoracic surgery, then met to discuss the cases and evaluate operability. Afterwards, PEA was performed in a high-volume center. Six to 12 months after PEA, patients were invasively reevaluated, using RHC, to confirm or exclude residual PH.
Echocardiographic parametersPatients underwent transthoracic echocardiography, with special attention given to the evaluation of right heart anatomy and function. Parameters used for statistical purposes were the following: tricuspid annular plane systolic excursion (TAPSE), tricuspid regurgitation peak velocity (TR peak), tele-diastolic right ventricular area (EDRVA), tele-systolic right ventricular area (ESRVA), right atrial tele-systolic area (RAP area), fractional area change (FAC), TAPSE/pulmonary artery systolic pressure ratio (TAPSE/PASP), diastolic (DER) and systolic eccentric ratio (SER), right ventricular outflow tract acceleration time (RVOT AccT), tricuspid tissue doppler imaging S′ wave velocity (tricuspid S′), peak velocity of pulmonary regurgitation (PR peak), tele-diastolic velocity of PR TD, estimated right ventricular-atrial gradient (RV-RA gradient), estimated sPAP, estimated mPAP, estimated diastolic pulmonary arterial pressure (estimated dPAP) and estimated right atrial pressure – through evaluation of inferior vena cava and respiratory sniff movement (estimated RAP).
When a significant proportion of the echocardiograms were performed, strain and volume analysis had not yet been standardized in our clinical practice, therefore, these parameters were not used for this study.
Residual PH definitionNo clear definition of residual PH has been provided so far. We used the 30 mmHg cutoff used by Cannon et al., which was associated with vasodilator initiation, and that reflects our clinical practice.11
Statistical analysisIndependent continuous parameters with normal distribution were expressed as mean±standard deviation (SD) and non-normal distribution data were expressed as median and interquartile range (IQR). Between groups comparisons were conducted using independent t-tests (for normal distribution date) and Mann–Whitney U test (for non-normal distribution data). For dependent continuous parameters, paired t-tests were used for normal distributed data and Wilcoxon test for non-normal distributed data. Categorical parameters were expressed as absolute and relative frequencies, and comparisons were performed using chi-squared tests, given their independent status.
All echo parameters that were significantly different between the two groups were evaluated in terms of association with residual PH, using univariate logistic regression. Those parameters that achieved statistical significance in univariate analysis, were subjected to multivariate logistic regression. Afterwards, receiver operator curves (ROC) curves were performed to evaluate optimal cutoffs to define higher risk of residual PH development. A p-value <0.05 was considered statistically significant, as for logistic regression, parameters that achieved p-value <0.10 in univariate analysis were included in the multivariate analysis.
All statistical analysis was performed using SPSS© version 28.0 (IBM® Statistics, Armonk, New York, USA).
ResultsPopulation at diagnosisEighty-six patients were diagnosed with CTEPH between January 2010 and October 2024. Forty patients were deemed operable and proposed for PEA. One patient was lost to follow-up as she moved abroad after the PEA proposal. Thirty-nine patients were then included in our analysis (Figure 1), with 18 patients developing residual PH after PEA.

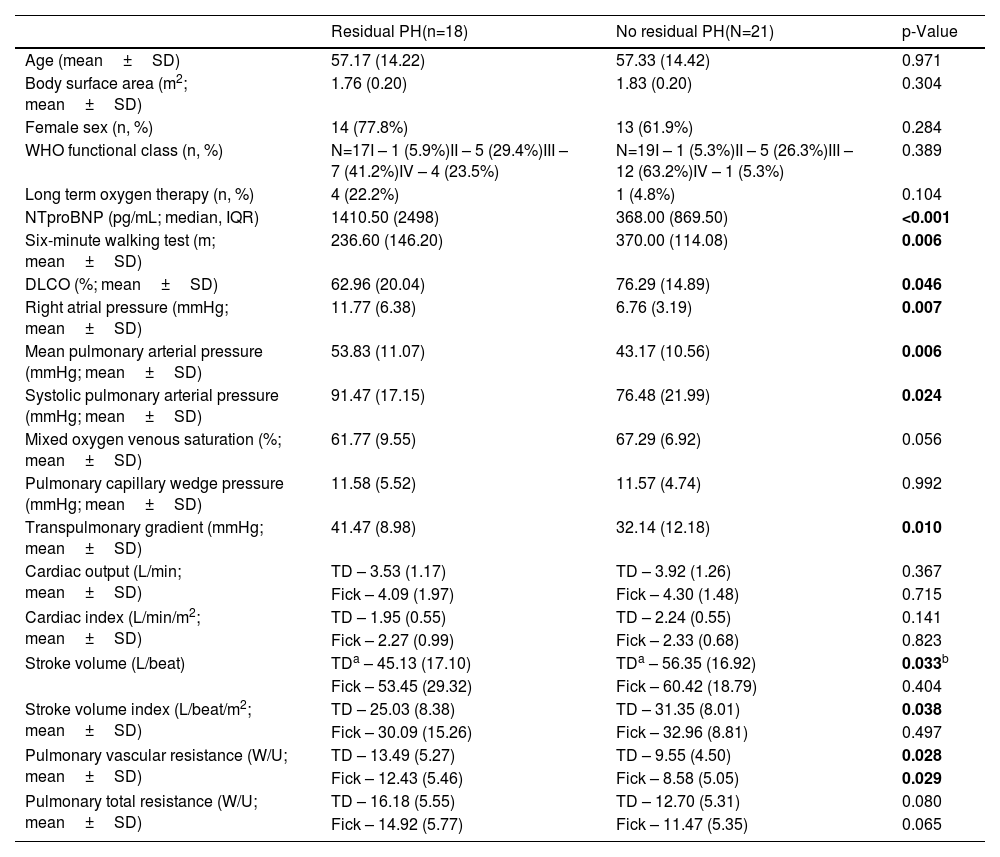
Patient and hemodynamic characteristics at diagnosis are shown in Table 1. Mean age at diagnosis is similar between the two groups, around 57 years-old. Most patients with CTEPH diagnosis (70%) and residual PH (77.8%) are female, like the figures observed in other cohorts. Patients who developed residual PH also had higher values of NTproBNP, lower distance on six-minute walking test and lower diffusing lung capacity of the lungs for carbon monoxide (DLCO) at CTEPH diagnosis. Hemodynamically, patients who developed residual PH tended to have higher mPAP, systolic pulmonary arterial pressure and pulmonary vascular resistance (PVR), with lower stroke volume (either indexed to body surface area or not).
Patient and haemodynamic parameters evaluated at diagnosis.
| Residual PH(n=18) | No residual PH(N=21) | p-Value | |
|---|---|---|---|
| Age (mean±SD) | 57.17 (14.22) | 57.33 (14.42) | 0.971 |
| Body surface area (m2; mean±SD) | 1.76 (0.20) | 1.83 (0.20) | 0.304 |
| Female sex (n, %) | 14 (77.8%) | 13 (61.9%) | 0.284 |
| WHO functional class (n, %) | N=17I – 1 (5.9%)II – 5 (29.4%)III – 7 (41.2%)IV – 4 (23.5%) | N=19I – 1 (5.3%)II – 5 (26.3%)III – 12 (63.2%)IV – 1 (5.3%) | 0.389 |
| Long term oxygen therapy (n, %) | 4 (22.2%) | 1 (4.8%) | 0.104 |
| NTproBNP (pg/mL; median, IQR) | 1410.50 (2498) | 368.00 (869.50) | <0.001 |
| Six-minute walking test (m; mean±SD) | 236.60 (146.20) | 370.00 (114.08) | 0.006 |
| DLCO (%; mean±SD) | 62.96 (20.04) | 76.29 (14.89) | 0.046 |
| Right atrial pressure (mmHg; mean±SD) | 11.77 (6.38) | 6.76 (3.19) | 0.007 |
| Mean pulmonary arterial pressure (mmHg; mean±SD) | 53.83 (11.07) | 43.17 (10.56) | 0.006 |
| Systolic pulmonary arterial pressure (mmHg; mean±SD) | 91.47 (17.15) | 76.48 (21.99) | 0.024 |
| Mixed oxygen venous saturation (%; mean±SD) | 61.77 (9.55) | 67.29 (6.92) | 0.056 |
| Pulmonary capillary wedge pressure (mmHg; mean±SD) | 11.58 (5.52) | 11.57 (4.74) | 0.992 |
| Transpulmonary gradient (mmHg; mean±SD) | 41.47 (8.98) | 32.14 (12.18) | 0.010 |
| Cardiac output (L/min; mean±SD) | TD – 3.53 (1.17) | TD – 3.92 (1.26) | 0.367 |
| Fick – 4.09 (1.97) | Fick – 4.30 (1.48) | 0.715 | |
| Cardiac index (L/min/m2; mean±SD) | TD – 1.95 (0.55) | TD – 2.24 (0.55) | 0.141 |
| Fick – 2.27 (0.99) | Fick – 2.33 (0.68) | 0.823 | |
| Stroke volume (L/beat) | TDa – 45.13 (17.10) | TDa – 56.35 (16.92) | 0.033b |
| Fick – 53.45 (29.32) | Fick – 60.42 (18.79) | 0.404 | |
| Stroke volume index (L/beat/m2; mean±SD) | TD – 25.03 (8.38) | TD – 31.35 (8.01) | 0.038 |
| Fick – 30.09 (15.26) | Fick – 32.96 (8.81) | 0.497 | |
| Pulmonary vascular resistance (W/U; mean±SD) | TD – 13.49 (5.27) | TD – 9.55 (4.50) | 0.028 |
| Fick – 12.43 (5.46) | Fick – 8.58 (5.05) | 0.029 | |
| Pulmonary total resistance (W/U; mean±SD) | TD – 16.18 (5.55) | TD – 12.70 (5.31) | 0.080 |
| Fick – 14.92 (5.77) | Fick – 11.47 (5.35) | 0.065 |
SD: standard deviation; W/U: Wood units.
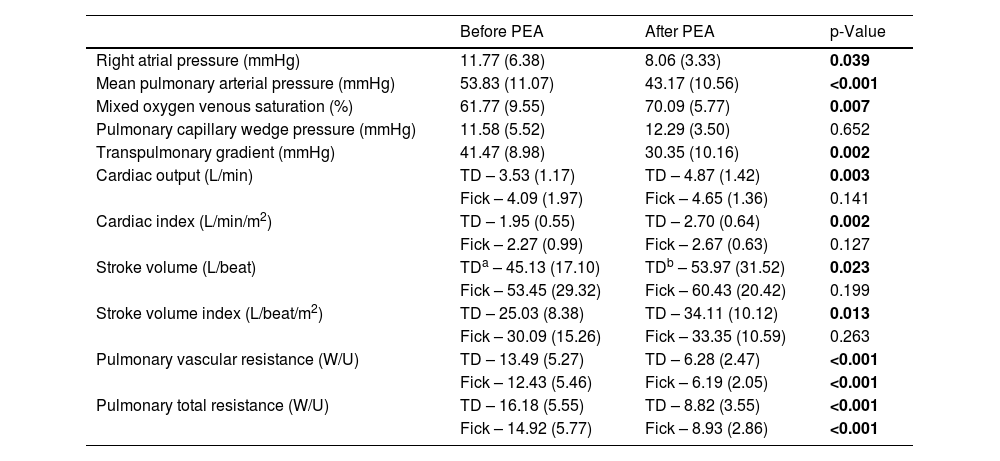
Post-PEA hemodynamics are exhibited in Table 2. The procedure is associated with lower mPAP and vascular resistance, and with higher cardiac output and index and mixed venous oxygen saturation.
Hemodynamic parameters in patients with residual PH, before and after PEA. All values are exhibited as mean (SD).
| Before PEA | After PEA | p-Value | |
|---|---|---|---|
| Right atrial pressure (mmHg) | 11.77 (6.38) | 8.06 (3.33) | 0.039 |
| Mean pulmonary arterial pressure (mmHg) | 53.83 (11.07) | 43.17 (10.56) | <0.001 |
| Mixed oxygen venous saturation (%) | 61.77 (9.55) | 70.09 (5.77) | 0.007 |
| Pulmonary capillary wedge pressure (mmHg) | 11.58 (5.52) | 12.29 (3.50) | 0.652 |
| Transpulmonary gradient (mmHg) | 41.47 (8.98) | 30.35 (10.16) | 0.002 |
| Cardiac output (L/min) | TD – 3.53 (1.17) | TD – 4.87 (1.42) | 0.003 |
| Fick – 4.09 (1.97) | Fick – 4.65 (1.36) | 0.141 | |
| Cardiac index (L/min/m2) | TD – 1.95 (0.55) | TD – 2.70 (0.64) | 0.002 |
| Fick – 2.27 (0.99) | Fick – 2.67 (0.63) | 0.127 | |
| Stroke volume (L/beat) | TDa – 45.13 (17.10) | TDb – 53.97 (31.52) | 0.023 |
| Fick – 53.45 (29.32) | Fick – 60.43 (20.42) | 0.199 | |
| Stroke volume index (L/beat/m2) | TD – 25.03 (8.38) | TD – 34.11 (10.12) | 0.013 |
| Fick – 30.09 (15.26) | Fick – 33.35 (10.59) | 0.263 | |
| Pulmonary vascular resistance (W/U) | TD – 13.49 (5.27) | TD – 6.28 (2.47) | <0.001 |
| Fick – 12.43 (5.46) | Fick – 6.19 (2.05) | <0.001 | |
| Pulmonary total resistance (W/U) | TD – 16.18 (5.55) | TD – 8.82 (3.55) | <0.001 |
| Fick – 14.92 (5.77) | Fick – 8.93 (2.86) | <0.001 |
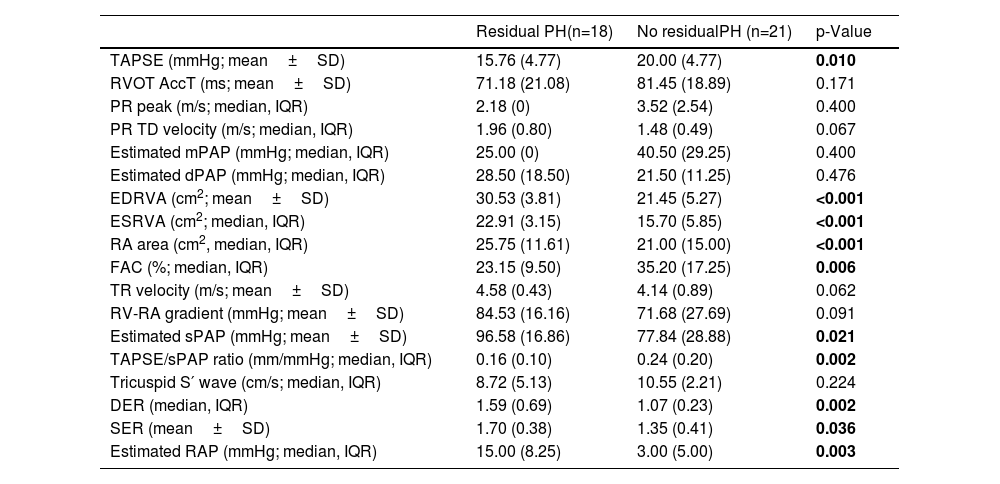
Echocardiographic parameters at diagnosis are exhibited in Table 3. Patients that developed residual PH after PEA had lower TAPSE (p=0.01), TAPSE/sPAP (p<0.01) and FAC (p=0.006); higher ventricular (p<0.001 for both EDRVA and ESRVA) and atrial areas (p<0.001), and eccentric ratios, either diastolic (p=0.002) and systolic (p=0.036).
Echo parameters evaluated at diagnosis.
| Residual PH(n=18) | No residualPH (n=21) | p-Value | |
|---|---|---|---|
| TAPSE (mmHg; mean±SD) | 15.76 (4.77) | 20.00 (4.77) | 0.010 |
| RVOT AccT (ms; mean±SD) | 71.18 (21.08) | 81.45 (18.89) | 0.171 |
| PR peak (m/s; median, IQR) | 2.18 (0) | 3.52 (2.54) | 0.400 |
| PR TD velocity (m/s; median, IQR) | 1.96 (0.80) | 1.48 (0.49) | 0.067 |
| Estimated mPAP (mmHg; median, IQR) | 25.00 (0) | 40.50 (29.25) | 0.400 |
| Estimated dPAP (mmHg; median, IQR) | 28.50 (18.50) | 21.50 (11.25) | 0.476 |
| EDRVA (cm2; mean±SD) | 30.53 (3.81) | 21.45 (5.27) | <0.001 |
| ESRVA (cm2; median, IQR) | 22.91 (3.15) | 15.70 (5.85) | <0.001 |
| RA area (cm2, median, IQR) | 25.75 (11.61) | 21.00 (15.00) | <0.001 |
| FAC (%; median, IQR) | 23.15 (9.50) | 35.20 (17.25) | 0.006 |
| TR velocity (m/s; mean±SD) | 4.58 (0.43) | 4.14 (0.89) | 0.062 |
| RV-RA gradient (mmHg; mean±SD) | 84.53 (16.16) | 71.68 (27.69) | 0.091 |
| Estimated sPAP (mmHg; mean±SD) | 96.58 (16.86) | 77.84 (28.88) | 0.021 |
| TAPSE/sPAP ratio (mm/mmHg; median, IQR) | 0.16 (0.10) | 0.24 (0.20) | 0.002 |
| Tricuspid S′ wave (cm/s; median, IQR) | 8.72 (5.13) | 10.55 (2.21) | 0.224 |
| DER (median, IQR) | 1.59 (0.69) | 1.07 (0.23) | 0.002 |
| SER (mean±SD) | 1.70 (0.38) | 1.35 (0.41) | 0.036 |
| Estimated RAP (mmHg; median, IQR) | 15.00 (8.25) | 3.00 (5.00) | 0.003 |
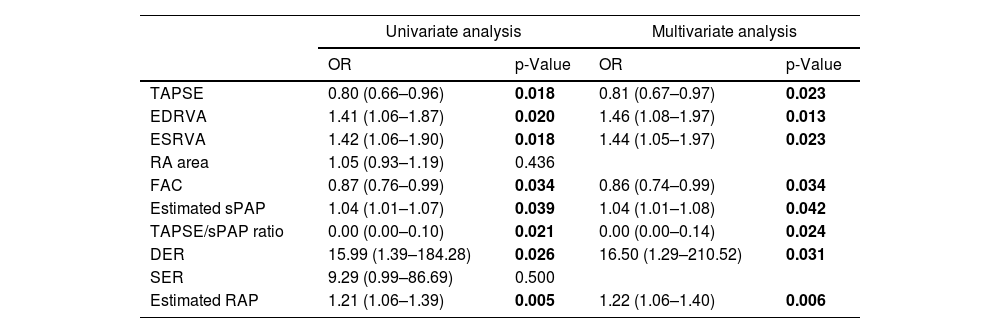
Logistic regression analysis is shown in Table 4. In fact, almost all the parameters that were significantly different between the two groups achieved significance in univariate analysis, except for SER and RA area. Those parameters were then subjected to multivariate analysis, along with multiple clinical – such as sex, age, body surface area, functional class and distance walked in 6-minutes walking test – and laboratorial – NTproBNP and DLCO – parameters. All the parameters that had statistical significance in univariate analysis were also significant in multivariate analysis, suggesting that those parameters are independent factors regarding development of residual PH.
Univariate and multivariate analysis of echo parameters at diagnosis, regarding prediction of residual PH.
| Univariate analysis | Multivariate analysis | |||
|---|---|---|---|---|
| OR | p-Value | OR | p-Value | |
| TAPSE | 0.80 (0.66–0.96) | 0.018 | 0.81 (0.67–0.97) | 0.023 |
| EDRVA | 1.41 (1.06–1.87) | 0.020 | 1.46 (1.08–1.97) | 0.013 |
| ESRVA | 1.42 (1.06–1.90) | 0.018 | 1.44 (1.05–1.97) | 0.023 |
| RA area | 1.05 (0.93–1.19) | 0.436 | ||
| FAC | 0.87 (0.76–0.99) | 0.034 | 0.86 (0.74–0.99) | 0.034 |
| Estimated sPAP | 1.04 (1.01–1.07) | 0.039 | 1.04 (1.01–1.08) | 0.042 |
| TAPSE/sPAP ratio | 0.00 (0.00–0.10) | 0.021 | 0.00 (0.00–0.14) | 0.024 |
| DER | 15.99 (1.39–184.28) | 0.026 | 16.50 (1.29–210.52) | 0.031 |
| SER | 9.29 (0.99–86.69) | 0.500 | ||
| Estimated RAP | 1.21 (1.06–1.39) | 0.005 | 1.22 (1.06–1.40) | 0.006 |
OR: odds ratio.
Using ROC curves, we aimed to get the optimal cutoffs for the various parameters that shown significance in multivariate analysis. As can be seen in Figures 2–4, EDRVA, ESRVA and DER obtained AUC above 0.75, threshold that were considered optimal, due to the need for high sensitivity and specificity when cutoffs are considered. The optimal value obtained for EDRVA was 27.13 cm2, with an AUC of 0.88, sensitivity of 89% and specificity of 85% (p=0.003). As for ESRVA, the value obtained was 19.54 cm2, with an AUC of 0.875, sensitivity of 88% and specificity of 85% (p=0.005). And for DER, the value obtained was 1.14, with an AUC of 0.783, sensitivity of 86% and specificity of 69% (p=0.008).

We then stratified our cohort using the abovementioned cutoffs. Regarding EDRVA, the cutoff value of 27.13 cm2 achieved an odds ratio (OR) of 44 [chi-squared test (χ2) 11.59, p<0.001], with a negative predictive value (NPV) of 92%. As for ESRVA, the cutoff value of 19.54 achieved an OR of 38.5 (χ2 10.52, p=0.001), with a NPV of 92%. Finally, for the cutoff value was 1.14, with an OR of 13.2 (χ2 9.02, p=0.003), with a positive predictive value of 86%.
DiscussionThis is, to our knowledge, the first study evaluating echocardiographic predictors of post-PEA residual PH.
The right heart has unique anatomy, as it is a relatively low pressure, high compliance chamber.13 Thromboembolic and fibrotic lesions, as is the case in chronic thromboembolic disease, lead to higher pressure in the pulmonary vasculature and progressive higher afterload in the right heart (RH). Its response to pressure overload over time tends to evolve from a relatively “adaptive” remodeling, with compensatory concentric hypertrophy, up to “maladaptive” eccentric remodeling, due to exhaustion, with progressive right ventricle dilation and dysssynchrony.14–16 Most right ventricle contraction occurs in the longitudinal plane.17 In patients with pulmonary arterial hypertension, longitudinal function and shortening tend to diminish,18 and that contributes in greater part to the dysfunction of the RH.19,20 Desynchrony is one of the key elements of contractile dysfunction in pressure overload, and it tends to occur in relatively early stages of right ventricular dysfunction.16,21
In our cohort, we observed patients that developed residual PH had TAPSE <16 mm, compared to 20 mm in the patients that normalized pulmonary pressure after PEA. This reflects the loss of longitudinal function associated with worsening RH function. Even more obvious is the ventricular dilation already present in patients that developed residual PH, reflecting the “maladaptive” remodeling associated with prolonged pressure overload, with distortion of the RH anatomy and function. Also, the loss of systolic function and continuous high afterload, in the long term, tends to result in diastolic dysfunction and volume overload, which reflects in the right atrium,13,22 with its dilation and pressure elevation, also seen in our residual PH cohort.
Ventricular-arterial coupling is also one of the key elements in RH function, and even more in its dysfunction.23–25 The gold standard for its measurement is with conductance catheterization; however, in recent years, indirect surrogates have been investigated, with TAPSE/sPAP being one of the most extensive studied.26 In PAH patients, TAPSE/sPAP is now a parameter to consider in the ESC/ERS 2022 risk calculator.1 Its use in CTEPH is still limited, but recent data have shown good hemodynamic and prognostic correlation.27,28 In our cohort, patients with residual PH revealed lower TAPSE/sPAP, reflecting ventricular-arterial uncoupling in these patients, and probably its non-reverse remodeling after PEA. Unfortunately, we could not find an optimal threshold for TAPSE/sPAP.
Hemodynamically, we have seen significant changes after PEA but patients with residual PH maintained high mPAP and PVR. Cannon et al. showed that patients with mPAP >38 mmHg and PVR >5.3W/U (425 Dynes−1) after PEA were associated with worse outcomes, prompting initiation of vasodilator therapy.11
There are some clinical clues that could also be associated with the development of residual PH. Lower values of DLCO have been associated with microvasculopathy, reflecting affection on smaller vessels, which are not approachable by PEA.29,30 Also, higher titers of NTproBNP are associated with higher disease burden, especially values >1200 pg/mL.31
Although we used the mPAP cutoff of 30 mmHg, which reflects our clinical practice in terms of pulmonary vasodilator usage, the results were similar when we used the 25 mmHg cutoff, adding two more patients to the residual PH group.
Surprisingly, our original cohort had 45% of patients with residual PH, which is a lot higher than the 25% estimated by Hsieh et al.,9 although not different from other registries. As it is reflected in Table 1, age, functional class, BSA or sex were not different between the two groups, hence they were not associated with worse course of disease or progressive PH.
Our study has several limitations. First, our cohort was small. Second, values obtained by ROC curves were not validated in different cohorts and cannot be used for clinical purposes or interpreted for future risk stratification. Finally, unfortunately, could not use strain or RH volumes since some of the echocardiograms are old and the images could not be retrieved for post-exam analysis at our workstation. This was especially the case for strain, as demonstrated in various studies, mostly in CTEPH patients who underwent ballon pulmonary angioplasty.32,33
It also has strengths. First, it is the first study that extensively evaluates pre-PEA echocardiographic parameters and its use in predicting residual PH after PEA. Second, the high percentage of patients with residual PH, close to 50%, keeps strong comparability with patients without residual PH. Also, the similarity of age, sex, BSA and functional class adds strength in terms of comparability between groups. Third, it shows that ventricular remodeling, here translated in terms of right ventricular area, could be paramount in the development of residual PH. Lastly, this study emphasizes the need for a thorough echocardiogram on CTEPH diagnosis, showing the anatomic and functional changes in the RH, and their contribution to the course of disease.
ConclusionOur study shows that certain echocardiographic parameters could be predictors of the development of residual PH after PEA. Ventricular and atrial remodeling, longitudinal function and ventricular-arterial coupling are independently associated with residual PH, but validation in larger cohorts is mandatory.
Conflicts of interestThe authors have no conflicts of interest to declare.
