


Corrected QT interval (QTc) >460 ms in the right precordial leads has been described as a predictor of malignant ventricular arrhythmias (MVA) in patients with Brugada syndrome (BrS).
ObjectiveTo assess the presence of QTc>460 ms in multiple electrocardiograms (ECGs) during follow-up as a predictor of recurrence of MVA in patients with BrS.
MethodsThe study group included 43 patients with BrS and an implantable cardioverter-defibrillator. ECGs were performed serially between June 2000 and January 2017. QT interval was measured and QTc was obtained by Bazett's formula. The sample was divided into three groups: Group 1 (patients with no ECGs with QTc>460 ms); Group 2 (patients with only one ECG with QTc>460 ms); and Group 3 (patients with two or more ECGs with QTc>460 ms).
ResultsThe following variables were more frequently observed in Group 3: family history of sudden death (p=0.023), previous history of cardiorespiratory arrest (p=0.032), syncope (p=0.039), documented MVA (p=0.002), and proportion of ECGs with coved-type ST interval during follow-up (p=0.002). In Group 3, 67% of BrS patients had events during follow-up, as opposed to only 22% of Group 1 and 14% of Group 2 (Group 1 vs. Group 2, p=0.33015; Group 1 vs. Group 3, p=0.04295; and Group 2 vs. Group 3, p=0.04155).
ConclusionsQTc>460 ms in more than one ECG during follow-up increases the risk of MVA events in patients with BrS.
Um intervalo QTc>460 ms nas derivações precordiais direitas foi descrito como um fator preditivo de arritmias ventriculares malignas em doentes com síndrome de Brugada (SB).
ObjetivoAvaliar se a presença de QTc>460 ms em eletrocardiogramas (ECGs) seriados durante o seguimento é um fator preditivo de recidiva de arrtimias ventriculares malignas em doentes com SB.
MétodosO grupo de estudo incluiu 43 doentes com SB e com cardioversor-desfibrilhador implantável; os ECGs seriados foram efetuados entre junho de 2000 e janeiro de 2017. Foi medido o intervalo QT, tendo sido o QTc obtido através da fórmula de Bazzet. Os doentes foram divididos em três grupos: Grupo 1 (doentes sem ECGs com QTc>460 ms); Grupo 2 (doentes com apenas um ECG com QTc>460 ms) e Grupo 3 (doentes com dois ou mais ECGs com QTc>460 ms).
ResultadosAs seguintes variáveis foram observadas com mais frequência no Grupo 3: história familiar de morte súbita (p=0,023), história prévia de paragem cardiorrespiratória (p=0,032), síncope (p=0,039), arritmias ventriculares malignas documentadas (p=0,002) e percentagem de ECGs convexos durante o seguimento (p=0,002). No Grupo 3, 67% dos doentes com SB apresentaram eventos durante o seguimento. Por outro lado, no caso dos doentes com SB apenas 22% do Grupo 1 e 14% do Grupo 2 apresentaram eventos durante o seguimento (Grupo 1 versus Grupo 2, p=0,33015; Grupo 1 versus Grupo 3, p=0,04295 e Grupo 2 versus Grupo 3, p=0,04155).
ConclusõesO QTc>460 ms em mais do que um ECG durante o seguimento aumenta o risco de eventos de arrtimias ventriculares malignas.
Brugada syndrome (BrS) is a channelopathy associated with syncope or sudden cardiac death (SCD) due to malignant ventricular arrhythmias (MVA).1 Risk stratification in those who have presented aborted sudden death presents a significant challenge for medical personnel, who need to decide between conservative treatment, pharmacological therapy with quinidine, or placement of an implantable cardioverter-defibrillator (ICD).2–5 Prolongation of certain electrocardiographic parameters that reflect ventricular depolarization-repolarization, such as corrected QT interval (QTc) or T peak-T end interval, has been associated with an increased risk of MVA.6–8 This study was designed to assess the presence of QTc>460 ms in multiple electrocardiograms (ECGs) during follow-up, as a predictor of recurrence of MVA in patients with BrS.
MethodsA retrospective study was performed at the Institute of Cardiology and Cardiovascular Surgery, Havana, Cuba, which included patients between June 2000 and January 2018.
Study populationForty-three patients with BrS and an ICD who underwent serial ECGs during follow-up (after ICD implantation, after one month, after three months and every six months thereafter) who did not present the exclusion criterion of less than three ECGs were included in the study. The sample was divided into three groups: Group 1 (patients with no ECGs with QTc>460 ms); Group 2 (patients with only one ECG with QTc>460 ms); and Group 3 (patients with two or more ECGs with QTc>460 ms). For the purposes of this study a value of QTc>460 ms was considered as a predictor of MVA based on the study by Castro et al.6 MVA were defined as ventricular tachycardia or ventricular fibrillation events identified by the ICD.
Electrocardiographic measurementsEach participant underwent a 12-lead ECG using a Cardiocid BB electrocardiograph at a paper speed of 25 mm/s. A coved-type pattern was defined as ≥2 mm ST-segment elevation with type 1 morphology in one or both of the right precordial leads V1 and V2 positioned in the second, third or fourth intercostal space.3 Electrocardiographic measurements were performed manually. The QT interval was measured in all 12 leads from the beginning of the QRS complex to the end of the T wave, defined as the insertion of the tangent of the descending portion of the T wave and the isoelectric line (Figure 1). The lead showing the longest QT was used.9 QTc was calculated by Bazett's formula.10 The measurements were performed by two independent observers, and in the case of a difference of >20 ms a third measurement was performed by another observer.
Statistical analysis
The statistical package IBM SPSS was used for data analysis. Continuous variables were presented as mean ± standard deviation and categorical variables as numbers and percentages. A value of p<0.05 was considered significant, between 0.01 and 0.05 moderately significant and <0.01 as highly significant. Group differences were analyzed by one-way analysis of variance followed by Scheffé’s multiple comparison tests. Continuous variables were compared using the dependent-samples t test. Kaplan-Meier survival curves were plotted, and the log-rank test was used to compare the curves.
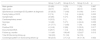
ResultsTable 1 summarizes the characteristics of the three groups. Male gender was predominant in all three groups. In the overall population, most presented a spontaneous coved-type pattern at diagnosis, more than 80% were symptomatic, and about 80% underwent programmed electrical stimulation, which was positive in around a quarter. In patients with two or more ECGs with QTc>460 ms (Group 3), a family history of SCD (p=0.023), previous history of cardiorespiratory arrest (p=0.032), syncope (p=0.039), and documented MVA (p=0.002) were significantly more frequent.
Demographic and clinical characteristics of the study population with Brugada syndrome (n=43).
| Group 1 (n=27) | Group 2 (n=7) | Group 3 (n=9) | p | |
|---|---|---|---|---|
| Male gender | 23 (85) | 3 (78) | 7 (78) | 0.987 |
| Age, years | 43±15 | 44±14 | 46±10 | 0.933 |
| Spontaneous coved-type ECG pattern at diagnosis | 25 (92.5) | 7 (100) | 9 (100) | 0.411 |
| Family history of SCD | 2 (7.4) | 1 (14) | 4 (44.4) | 0.023 |
| Symptomatic | 23 (85) | 5 (71) | 8 (89) | 0.202 |
| Cardiorespiratory arrest | 9 (33.3) | 0 (-) | 5 (56) | 0.032 |
| Syncope | 14 (48) | 5 (71) | 4 (44.4) | 0.039 |
| PES | 21 (77.7) | 7 (100) | 7 (78) | 0.426 |
| Positive PES | 4 (14.8) | 2 (28) | 3 (33.3) | 0.517 |
| Documented MVA | 8 (29.7) | 1 (14) | 6 (66.6) | 0.002 |
| Follow-up, months | 111±60 | 106±45 | 123±57 | 0.513 |
| Total ECGs during follow-up | 184 (63) | 51 (18) | 54 (19) | - |
| Coved-type pattern on ECG during follow-up | 68 (23.5) | 3.7 (1.2) | 34 (11.8) | 0.002 |
Values are presented as mean ± SD or n (%).
ECG: electrocardiogram; MVA: malignant ventricular arrhythmia; PES: programmed electrical stimulation; SCD: sudden cardiac death.
A total of 289 ECGs were performed, 63% of them in Group 1. In Group 3 the proportion of ECGs with coved-type pattern was greater, with a statistically significant difference (p=0.002). In the overall sample 41 ECGs were obtained with QTc>460 ms from 16 patients (Groups 2 and 3), accounting for 49% of the ECGs in these two groups (105 ECGs), meaning an ECG with QTc>460 ms appeared in one in two ECGs performed.
On the Kaplan-Meier curve for cumulative event-free survival (Figure 2), 67% of BrS patients in Group 3 had events during follow-up, as opposed to only 22% of Group 1 and 14% of Group 2 (Group 1 vs. Group 2, p=0.33015; Group 1 vs. Group 3, p=0.04295; and Group 2 vs. Group 3, p=0.04155).
Discussion
In 2003 Pitzalis et al.11 demonstrated that the QTc interval in V2 is prolonged in coved-type compared to non-coved-type ECGs in BrS patients. Later Castro et al.6 highlighted the usefulness of QTc>460 ms in V2 as a predictor of risk of MVA. The present study showed similar findings, as the maximum values of QTc in Groups 2 and 3 were found in V1 and/or V2, which electrically rules out an associated long QT syndrome, as prolonged QTc in DII and V6 is characteristic of the latter entity.12
In our study, among patients with QTc>460 ms (Groups 2 and 3), this value was recorded in just 49% of ECGs performed (41 of 105 ECGs), demonstrating the wide variability of QTc, which has been described by several authors including Goldenberg et al.13 and Baumert et al.14 Physiologically, QT presents variations in beat-to-beat measurements reflecting variations in ventricular depolarization-repolarization related to changes in autonomic tone, although under stable conditions this variability is low.14 It has been shown that in long QT syndrome there is a relationship between beat-to-beat QT variability and reduced repolarization reserve.15–17 On the other hand, it has been demonstrated that administration of a sodium channel blocker increased the standard deviation of the QTc interval in the right precordial leads in patients with BrS.18 This variability may explain the presence or absence of QTc>460 ms in patients with BrS; however, the authors have found no published data that identify a relationship between multiple ECGs with QTc>460 ms and the presence of MVA.
Study limitationsSignificant intra- and interobserver variability in manual measurements of QT has been demonstrated in various publications, so we would expect this to also occur in the other electrocardiographic parameters. Another limitation is the small number of patients in the sample studied.
ConclusionIn conclusion, our data demonstrated that the presence of a QTc interval >460 ms on more than one ECG during follow-up enhances the risk of MVA in patients with BrS.
Conflicts of interestThe authors have no conflicts of interest to declare.
