


A growing body of evidence shows the prognostic value of oxygen uptake efficiency slope (OUES), a cardiopulmonary exercise test (CPET) parameter derived from the logarithmic relationship between O2 consumption (VO2) and minute ventilation (VE) in patients with chronic heart failure (CHF).
ObjectiveTo evaluate the prognostic value of a new CPET parameter — peak oxygen uptake efficiency (POUE) — and to compare it with OUES in patients with CHF.
MethodsWe prospectively studied 206 consecutive patients with stable CHF due to dilated cardiomyopathy — 153 male, aged 53.3±13.0 years, 35.4% of ischemic etiology, left ventricular ejection fraction 27.7±8.0%, 81.1% in sinus rhythm, 97.1% receiving ACE-Is or ARBs, 78.2% beta-blockers and 60.2% spironolactone — who performed a first maximal symptom-limited treadmill CPET, using the modified Bruce protocol. In 33% of patients an cardioverter-defibrillator (ICD) or cardiac resynchronization therapy device (CRT-D) was implanted during follow-up.
Peak VO2, percentage of predicted peak VO2, VE/VCO2 slope, OUES and POUE were analyzed. OUES was calculated using the formula VO2 (l/min) = OUES (log10VE) + b. POUE was calculated as pVO2 (l/min) / log10peakVE (l/min). Correlation coefficients between the studied parameters were obtained. The prognosis of each variable adjusted for age was evaluated through Cox proportional hazard models and R2 percent (R2%) and V index (V6) were used as measures of the predictive accuracy of events of each of these variables. Receiver operating characteristic (ROC) curves from logistic regression models were used to determine the cut-offs for OUES and POUE.
ResultspVO2: 20.5±5.9; percentage of predicted peak VO2: 68.6±18.2; VE/VCO2 slope: 30.6±8.3; OUES: 1.85±0.61; POUE: 0.88±0.27. During a mean follow-up of 33.1±14.8 months, 45 (21.8%) patients died, 10 (4.9%) underwent urgent heart transplantation and in three patients (1.5%) a left ventricular assist device was implanted. All variables proved to be independent predictors of this combined event; however, VE/VCO2 slope was most strongly associated with events (HR 11.14). In this population, POUE was associated with a higher risk of events than OUES (HR 9.61 vs. 7.01), and was also a better predictor of events (R2: 28.91 vs. 22.37).
ConclusionPOUE was more strongly associated with death, urgent heart transplantation and implantation of a left ventricular assist device and proved to be a better predictor of events than OUES. These results suggest that this new parameter can increase the prognostic value of CPET in patients with CHF.
Vários estudos demonstraram que o declive da eficiência de consumo de O2 (DECO), derivado da relação logarítmica entre o consumo de O2 (VO2) e a ventilação minuto (VE) durante a prova de esforço cárdiorrespiratória (PECR), apresenta valor prognóstico independente de eventos em doentes (dts) com insuficiência cardíaca (IC) crónica.
ObjectivosAvaliar o valor prognóstico de um novo parâmetro da PECR, a eficiência do consumo de O2 no pico de esforço (ECOP) e compará-lo com o do DECO em dts com IC.
MétodosEstudámos, prospectivamente, 206 dts com miocardiopatia dilatada e IC estável (153 do sexo masculino, 53,3±13,0 anos, 35,4% isquémica, fracção de ejecção do VE 27,7±8,0%, 81,1% em ritmo sinusal, 97,1% sob i-ECA e/ou ARAII, 78,2% sob bloqueadores beta, 60,2% sob espironolactona), que efectuaram uma primeira PECR (máxima limitada por sintomas, em tapete rolante, protocolo de Bruce modificado). Em 33% dos dts foi implantado um cardioversor-desfibrilhador (CDI) ou um sistema de ressíncronização cardíaca com CDI (CRT-D) durante o seguimento.
Analisámos o VO2 de pico, a percentagem do VO2 máximo teórico atingida, o declive VE/VCO2, o DECO e o ECOP. O DECO foi calculado através da fórmula VO2 (L/min) = DECO (log10VE) + b. O ECOP foi calculado como ECOP=VO2p (L/min) / log10VE máximo (L/min). Os coeficientes de correlação entre os parâmetros estudados foram calculados. O prognóstico de cada variável ajustado por idade foi avaliado através dos modelos proporcionais de Cox e o R2 percentual e o V index foram utilizados como medidas de acuidade preditiva de eventos de cada uma destas variáveis. Recorremos às curvas ROC dos modelos de regressão logística para determinar o cut-off de cada parâmetro.
ResultadosVO2p: 20,5±5,9; percentagem do VO2 máximo teórico atingida: 68,6±18,2; declive VE/VCO2: 30,6±8,3; DECO: 1,85±0,61; ECOP: 0,88±0,27. Num seguimento médio de 33,1±14,8 meses após a inclusão no estudo, faleceram 45 dts (21,8%), 10 (4,9%) foram submetidos a transplantação cardíaca urgente e em três dts (1,5%) foi implantado um sistema de assistência ventricular. Todos os parâmetros estudados foram preditores independentes deste evento combinado. No entanto, o declive VE/VCO2 foi o parâmetro mais associado a eventos (RR 11,14). O ECOP associou-se, nesta população, a um maior risco de eventos que o DECO (RR 9,61 versus 7,01), tendo-se revelado também um melhor preditor de eventos (R2: 28,91 versus 22,37).
ConclusãoO ECOP associou-se mais a probabilidade de morte, transplante cardíaco urgente e implantação de sistema de assistência ventricular e revelou-se um melhor preditor de eventos que o DECO. Os resultados obtidos sugerem que este novo parâmetro pode aumentar o valor prognóstico das PECR em doentes com IC.
Several cardiopulmonary exercise testing (CPET)-derived parameters have an established role in prognostic stratification of patients with chronic heart failure (CHF). In recent years the number of these variables has continued to grow.
In 1996, Baba et al.1 reported a new CPET-derived parameter, oxygen uptake efficiency slope (OUES), a marker of ventilatory efficiency that represents the relationship between minute ventilation and oxygen uptake during exercise. In that study, OUES showed a highly significant correlation with peak oxygen uptake (VO2) in a group of patients, predominantly children, with CHF.
Although this first study and others2 emphasized the value of OUES as a submaximal, effort-independent and objective parameter to estimate cardiorespiratory functional reserve, more recently it has been claimed to have enhanced prognostic value in CHF patients3,4. Myers et al.5, when defining a CPET score for predicting outcomes in this context, considered OUES to be a stronger predictor of risk than peak VO2.
The aim of the present study was to evaluate the prognostic value, in CHF patients, of another new CPET parameter of ventilatory efficiency proposed by our group – peak oxygen uptake efficiency (POUE). We set out to compare this easily obtained parameter with OUES, as well as with the prognostic value of other CPET-derived variables.
MethodsThis study was a single-center analysis that included patients with CHF due to left ventricular systolic dysfunction (LVSD) referred to our laboratory for a first CPET evaluation. Only patients with left ventricular ejection fraction <40% and free of exercise-limiting comorbidities such as cerebrovascular disease, musculoskeletal impairment, or peripheral vascular disease were included. Also, only patients with no significant respiratory disease, excluded by clinical history, physical examination and chest X-ray, were considered for the study. Patients gave informed consent for participation.
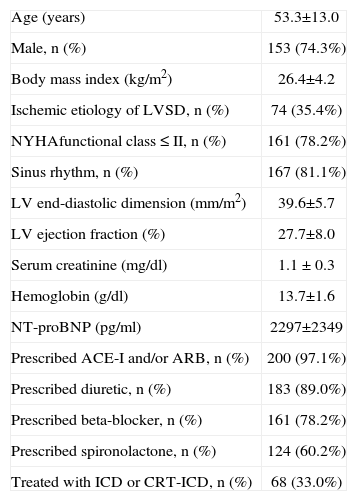
We prospectively studied 206 patients with CHF due to LVSD, 35.4% of ischemic etiology. There were 153 men (74.3%), mean age was 53.3±13.0 years (range 21 to 80), body mass index 26.4±4.2 kg/m2 (17.1 to 38.1), 81.1% in sinus rhythm, echocardiographic left ventricular end-diastolic dimension 39.6±5.7 mm/m2 (32 to 69) and ejection fraction 27.7±8.0% (10 to 39). According to the referring physician, 78.2% of the patients were in New York Heart Association class ≤II. Ninety-seven percent were medicated with an angiotensin-converting enzyme inhibitor or/and an angiotensin receptor blocker, 89.0% with a diuretic, 78.2% with a beta-blocker and 60.2% with spironolactone. Thirty-three percent presented or were treated during follow-up with an implantable cardioverter-defibrillator (ICD) or a cardiac resynchronization plus ICD device. The characteristics of the study population are summarized in Table 1.
Characteristics of the study population
| Age (years) | 53.3±13.0 |
| Male, n (%) | 153 (74.3%) |
| Body mass index (kg/m2) | 26.4±4.2 |
| Ischemic etiology of LVSD, n (%) | 74 (35.4%) |
| NYHAfunctional class ≤II, n (%) | 161 (78.2%) |
| Sinus rhythm, n (%) | 167 (81.1%) |
| LV end-diastolic dimension (mm/m2) | 39.6±5.7 |
| LV ejection fraction (%) | 27.7±8.0 |
| Serum creatinine (mg/dl) | 1.1 ±0.3 |
| Hemoglobin (g/dl) | 13.7±1.6 |
| NT-proBNP (pg/ml) | 2297±2349 |
| Prescribed ACE-I and/or ARB, n (%) | 200 (97.1%) |
| Prescribed diuretic, n (%) | 183 (89.0%) |
| Prescribed beta-blocker, n (%) | 161 (78.2%) |
| Prescribed spironolactone, n (%) | 124 (60.2%) |
| Treated with ICD or CRT-ICD, n (%) | 68 (33.0%) |
ACE-I: angiotensin-converting enzyme inhibitor;
ARB: angiotensin receptor blocker; CRT: cardiac resynchronization therapy; ICD: implantable cardioverter-defibrillator;
LV: left ventricular; LVSD: left ventricular systolic dysfunction;
NT-proBNP: N-terminal pro-B-type natriuretic peptide;
NYHA: New York Heart Association.
All subjects underwent maximal symptom-limited treadmill CPET, using the modified Bruce protocol (GE Marquette Series 2000 treadmill). The 12-lead electrocardiogram and heart rate were recorded continuously during the test and continued for six minutes of the recovery period. Blood pressure was measured at rest, during the last 30 seconds of each stage, at peak exercise and at the first, third and sixth minute of the recovery phase.
In no case did altered blood pressure, arrhythmia, chest pain or electrocardiographic changes lead to interruption of the test, in accordance with international standards7. All studies were, accordingly, interrupted by subjective fatigue or dyspnea preventing the patient from continuing the exercise. No medication was discontinued before the test.
Minute ventilation (VE in l/min), oxygen uptake (VO2 in l/min) and carbon dioxide production (VCO2 in l/min) were acquired breath-by-breath, using a SensorMedics Vmax 229 gas analyzer. Gas analysis was preceded by calibration of the equipment and began three minutes prior to exercise.
Patients were encouraged to perform exercise until the VCO2/VO2 ratio (respiratory exchange ratio – RER) was ≥1.10. Besides RER, other derived variables were calculated, including ventilatory equivalent for oxygen (VE/ VO2) and for carbon dioxide (VE/VCO2).
Peak VO2 was expressed as the highest VO2 attained during the final 30 seconds of exercise2. For prognostic evaluation only peak VO2 normalized for body mass (ml/kg/min) – for fat-free mass in obese patients (body mass index >30 kg/ m2) – was considered. Predicted peak VO2 (in l/min, and in ml/kg/min) and the percentages of the predicted values achieved were calculated by the system software.
The ventilatory anaerobic threshold (AT) was determined using the V-slope method, and corrected, when necessary, using the VE/VO2 versus VE/VCO2 criterion and/or the end-tidal oxygen and carbon dioxide partial pressures method1,8. Inability to achieve AT was an exclusion criterion.
The VE/VCO2 slope was calculated as the slope of the regression line relating VE to VCO2 during exercise, with data obtained over the complete duration of exercise9.
OUES was calculated by averaging VE and VO2 over 10-second intervals6, for the entire exercise duration, using the following equation: VO2 (l/min) = a (log10VE) + b, where a = OUES1. POUE was calculated as peak VO2/log10 peak VE.
In a subset of patients – the last 50 patients (39 [78%] male, age 54.8±13.3 years) – a new parameter of ventilatory efficiency, oxygen uptake efficiency at AT (OUEAT) was calculated, as OUEAT=VO2 (l/min) at AT / log10 VE at AT.
Patients were followed for major cardiac events (death, urgent transplantation or left ventricular assist device implantation). Mean follow-up in patients without events was 33.1±14.8 months (9 to 69).
Statistical analysisResults are expressed as means ± one standard deviation. Correlations between variables were assessed by linear regression analysis. Correlation coefficients were compared using the Fisher r-to-z transformation. A p value of <0.05 was considered statistically significant.
The prognostic value of each variable was assessed through Cox proportional hazard models adjusted for age. R2 percent (R2%) and V index (V6) were used as measures of the predictive accuracy of each of these variables. ROC (receiver operating characteristic) curves from logistic regression models were used to find cut-offs for OUES and POUE and to evaluate their specificity and sensitivity.
All tests were performed using the statistical program R Development Core Team. R: (A language and environment for statistical computing. R Foundation for Statistical Computing, Vienna, Austria).
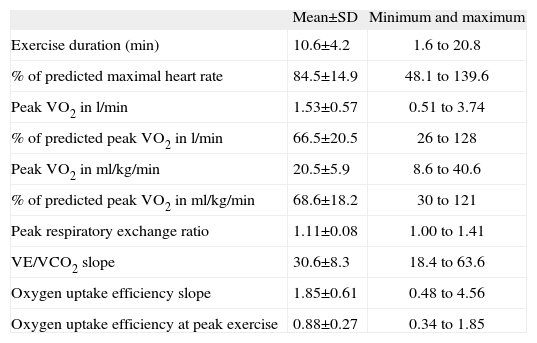
ResultsThe CPET results are presented in Table 2.
Exercise characteristics
| Mean±SD | Minimum and maximum | |
| Exercise duration (min) | 10.6±4.2 | 1.6 to 20.8 |
| % of predicted maximal heart rate | 84.5±14.9 | 48.1 to 139.6 |
| Peak VO2 in l/min | 1.53±0.57 | 0.51 to 3.74 |
| % of predicted peak VO2 in l/min | 66.5±20.5 | 26 to 128 |
| Peak VO2 in ml/kg/min | 20.5±5.9 | 8.6 to 40.6 |
| % of predicted peak VO2 in ml/kg/min | 68.6±18.2 | 30 to 121 |
| Peak respiratory exchange ratio | 1.11±0.08 | 1.00 to 1.41 |
| VE/VCO2 slope | 30.6±8.3 | 18.4 to 63.6 |
| Oxygen uptake efficiency slope | 1.85±0.61 | 0.48 to 4.56 |
| Oxygen uptake efficiency at peak exercise | 0.88±0.27 | 0.34 to 1.85 |
VCO2: carbon dioxide production; VE: minute ventilation; VO2: oxygen uptake.
A significant and strong correlation was found between OUEP and OUES – r=0.914, r2=0.836, p<0.001 (Figure 1). The correlations between OUES and OUEP with peak VO2 expressed in l/min were, respectively, r=0.876, r2=0.768 (p<0.001) and r=0.983, r2=0.966 (p<0.001) (comparison between correlations: p<0.001). For the same variables the correlations with peak VO2 in ml/kg/min were, respectively, r=0.744, r2=0.554 (p<0.001) and 0.834, r2=0.696 (p<0.001) (comparison between correlations: p=0.0147).

Peak VO2 also presented significant correlations with VE/VCO2 slope, the highest being when it was expressed in ml/kg/min – r=0.624, r2=0.389 (p<0.001), but this correlation was weaker than any obtained between peak VO2 and OUES or OUEP (p<0.025).
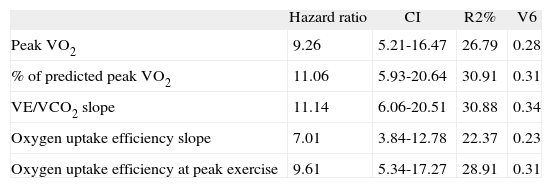
During follow-up, 45 patients (21.8%) died, 10 (4.9%) underwent urgent heart transplantation and in three patients (1.5%) a left ventricular assist device was implanted as a bridge for transplantation. All studied parameters were shown to be independent predictors of the combined event (Table 3, Figure 2).
Prognostic evaluation of each studied parameter
| Hazard ratio | CI | R2% | V6 | |
| Peak VO2 | 9.26 | 5.21-16.47 | 26.79 | 0.28 |
| % of predicted peak VO2 | 11.06 | 5.93-20.64 | 30.91 | 0.31 |
| VE/VCO2 slope | 11.14 | 6.06-20.51 | 30.88 | 0.34 |
| Oxygen uptake efficiency slope | 7.01 | 3.84-12.78 | 22.37 | 0.23 |
| Oxygen uptake efficiency at peak exercise | 9.61 | 5.34-17.27 | 28.91 | 0.31 |
CI: confidence interval; V6: V index.
. B: Percentage of predicted peak VO2. C: VE/VCO2 slope. D: OUES. E: POUE.")
Of all the studied parameters, VE/VCO2 slope was the most closely associated with events, followed by percentage of predicted peak VO2 and POUE (hazard ratio 11.14, 11.06 and 9.61 respectively). These three variables were also the best predictors of events (Table 3). In this population, POUE was more strongly associated with increased risk of death, urgent transplantation or left ventricular assist device implantation when compared directly with OUES (HR 9.61 vs. 7.01), and also proved to be a better predictor of events (R2% 28.91 vs. R2% 22.37 and V6 0.31 vs. V6 0.23). Figure 2 shows Kaplan-Meier curves for the studied parameters.
The ROC curve plotted for OUES showed an area under the curve (AUC)=0.819. The AUC for POUE was similar (0.815) (Figure 3). For OUES a cut-off value of 1.60 had sensitivity of 76% and specificity of 76% for the occurrence of events. For POUE a cut-off value of 0.73 showed sensitivity of 72% and specificity of 86% for events.

In a subset of 50 patients we evaluated OUEAT – mean=0.79±0.22 (0.32 to 1.47). OUEAT correlated both with OUES (r=0.901, r2=0.811, p<0.001) and with OUEP (r=0.959, r2=0.919, p<0.001), the latter correlation being stronger (p<0.001). OUEAT also showed a significant correlation with peak VO2 (r=0.930, r2=0.966, p<0.001), and this correlation was also stronger than that between OUES and peak VO2 (p=0.0025), although weaker than for OUEP (p<0.001).
DiscussionOUES is a non-linear measure of the ventilatory response to exercise derived from the single-segment logarithmic relation between oxygen uptake and minute ventilation during incremental exercise1,2. It incorporates, in a single index, not only cardiovascular and peripheral factors that determine oxygen uptake, but also pulmonary factors that influence ventilatory response to exercise. It is a submaximal and effort-independent parameter, and, unlike pVO2, does not rely on the last segment of the exercise. Instead, it uses the whole of the exercise data, even if submaximal, which can be an advantage in patients who do not tolerate maximal exertion or with a low motivation to finish the test.
On the basis of this logarithmic relation, log VE at peak exercise and at ventilatory anaerobic threshold was used to calculate, respectively, OUEP and OUEAT. Strong correlations were found between OUES, OUEP and OUEAT, and also between these three variables of ventilatory efficiency and peak VO2. The prognostic value of OUEP in the study population was at least similar to that of OUES – OUEAT was only calculated in a subset of patients, and its prognostic value was not analyzed. OUEP is more easily obtained than OUES, and our results suggest that in maximal CPET it can replace it for prognostic evaluation.
In our study the average of VE and VO2 over 10-second intervals was used to calculate OUES, rather than on a breath-by-breath basis. This method has been used by others6,10.
It should be emphasized that the established role of OUES as a submaximal and objective parameter to estimate cardiorespiratory functional reserve1,2 was not called into question by our study, as only its value for the entire exercise duration was analyzed.
Ventilatory efficiency has been more widely evaluated by the relation between VE and VCO2. Both the value obtained from the slope of the regression line relating VE to VCO2 during exercise – the VE/VCO2 slope – and their simple ratio at peak exercise showed prognostic value in patients with CHF due to LVSD. Arena et al.10 found that, although not identical, VE/VCO2 slope and ratio at peak exercise provide similar prognostic information. Nevertheless, ventilatory efficiency has been typically expressed as the VE/VCO2 slope, and several studies have reported it as being the strongest prognostic marker in patients with CHF when assessed at peak exercise11,12. In our study we did not evaluate the VE/VCO2 ratio at peak exercise. The VE/VCO2 slope provided greater prognostic information than peak VO2 and OUES, confirming the results of other authors13,14.
We studied a young population with CHF. This may explain why most of the patients were referred for heart transplantation evaluation. It may also explain the stronger prognostic value of the percentage of predicted peak VO2 achieved over the absolute value of peak VO2. A study by Bard et al.11 evaluated a typical population referred for heart transplantation in the United States of America, with mean age 50.6±10.2 years, 72% men, 55% with LVSD of nonischemic etiology, left ventricular ejection fraction 21.5±7.7%, peak VO2 17.3±5.0 ml/kg/min, and percentage of predicted peak VO2 achieved 58.7±18.2%. Comparison with our study population prompts the comment that in Portugal the most important factor leading to referral for heart transplantation is left ventricular ejection fraction, even more than the patient's functional capacity.
ConclusionsAccording to our results, for prognostic assessment in patients with CHF due to LVSD, OUEP is superior to OUES and even to peak VO2, and inferior to VE/VCO2 slope. However, these are the results of a single-center study, and should be confirmed or refuted by others.
Conflicts of interestThe authors have no conflicts of interest to declare.
