


The aim of this study was to determine whether changes to referral protocols for cardiac surgery have had an impact on waiting times, hospitalizations and mortality during the waiting period and during the first year of follow-up after surgery.
MethodsIn this retrospective study of patients referred for cardiac surgery between January 1, 2008 and September 30, 2014, the study population was divided into two groups: those referred before (group A, January 1, 2008 to August 31, 2011) and after (group B, September 1, 2011 to September 30, 2014) the change in referral protocols. A telephone follow-up was conducted.
ResultsThere were 864 patients referred for cardiac surgery, 557 in group A and 307 in group B. Patient characteristics were similar between groups. The mean waiting time for surgery was 10.6±18.5 days and 55.7±79.9 days in groups A and B, respectively (p=0.00).
During the waiting period two patients (0.4%) were hospitalized in group A and 28 (9.1%) in group B (p=0:00); mortality was, respectively, 0% and 2.3% (p=0.00). During one-year follow-up 12.8% of group A patients and 16% of group B patients were hospitalized. Cardiovascular mortality in this period was around 5% in both groups (p>0.05).
ConclusionChanges to referral protocols for cardiac surgery had an impact on waiting times, on the number of hospitalizations and on mortality in this period.
O objetivo deste estudo foi determinar se as alterações aos protocolos de referenciação para cirurgia cardíaca tiveram impacto nos tempos de espera, taxa de internamentos e na mortalidade durante o período de espera e durante o primeiro ano de seguimento após cirurgia.
Materiais e métodosEstudo retrospetivo, com doentes referenciados para cirurgia cardíaca de 1/01/2008 a 30/09/2014. Avaliaram-se dois grupos de doentes antes e depois da mudança de referenciação: grupo A entre 1/01/2008 e 01/08/2011 e grupo B entre 01/08/2011 e 30/09/2014. Foi realizado o follow-up telefónico.
ResultadosForam referenciados 864 doentes para cirurgia cardíaca, 557 no grupo A e 307 no grupo B. As características dos grupos foram semelhantes. O número médio de dias de espera para cirurgia foi de 10,6 ± 18,5 dias e de 55,7 ± 79,9 dias, respetivamente no grupo A e B (p = 0,00).
Durante o período de espera foram internados dois doentes (0,4%) no grupo A e 28 (9,1%) no grupo B (p = 0,00); a taxa de mortalidade foi, respetivamente, de 0-2,3% (p = 0,00). Durante o período de follow-up de um ano foram admitidos em internamento 12,8% dos doentes do grupo A e 16% dos doentes do grupo B. A mortalidade neste período foi de cerca de 5% em ambos os grupos (p > 0,05).
ConclusãoAs alterações aos protocolos de referenciação para cirurgia cardíaca tiveram impacto nos tempos de espera, no número de internamentos e na mortalidade nesse período.
Cardiothoracic surgery departments are concentrated in a few hospitals in Portugal. In order to meet the needs of the various cardiology centers, there are referral protocols for patients requiring cardiac surgery. Following the recommendations of the Regional Health Authorities, these protocols were altered in August 2011.
These changes were mainly made for economic reasons, in an attempt to reduce national health system costs. They may have affected waiting times for surgery, but there is as yet no evidence to support this. Several authors have shown that increased waiting times for coronary artery bypass grafting (CABG) are associated with a rise in mortality during the waiting period.1–13
The aim of this study was to determine whether these changes have had an impact on waiting times of patients referred for cardiac surgery and on hospitalizations and mortality during the waiting period and during the first year of follow-up after surgery.
MethodsWe performed a retrospective, descriptive and correlational study of all patients referred for cardiac surgery by our cardiology department between January 1, 2008 and September 30, 2014. Data on baseline characteristics, waiting times for surgery (defined as the interval between the date of admission to the cardiology department and the day that information on the patient was sent to the surgical center), and events (death or hospitalization) during the waiting period were taken from patients’ medical records. For the purposes of the study, cases were only considered urgent if they had been indicated as such in patients’ records, using the following criteria: for coronary patients, those admitted for myocardial infarction and severe coronary disease (left main disease, disease of the proximal anterior descending artery or three-vessel disease), and for valve patients, those admitted for heart failure requiring ventilation and refractory to medical therapy.
The patients were divided into two groups: group A, those referred for surgery between January 1, 2008 and August 31, 2011); and group B, those referred between September 1, 2011 and September 30, 2014). The month of August 2011 was chosen to divide the two groups because it was then that the referral protocols were changed.
Baseline characteristics, waiting times and events were compared between the groups.
A telephone follow-up was conducted by a cardiologist of patients referred for cardiac surgery during the period under analysis, and events at one year were recorded.
SPSS 20.00 was used for the statistical analysis. Categorical variables were compared by the chi-square test, continuous variables were compared using one-way ANOVA, and survival curves during the waiting period and during the first year of follow-up were constructed using the Kaplan-Meier method.
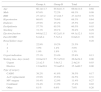
ResultsDuring the study period 864 patients were referred for cardiac surgery, mean age 66.0±11.6 years, 268 (31%) female and 596 (69%) male. A total of 557 cardiac surgeries were requested by our department between January 1, 2008 and August 31, 2011 (group A), and 307 between September 1, 2011 and September 30, 2014 (group B).
The baseline characteristics of the two groups were similar (Table 1), both in mean logistic EuroSCORE (6.2% in group A and 5.7% in group B [p=0.36]), and in risk factors: male gender (67.6% vs. 72.2%), hypertension (68.6% vs. 70.6%) and diabetes (25.9% vs. 25.2%). Dyslipidemia was the exception (57.7% vs. 65.5%, p=0.03). There was no significant difference between the groups in the incidence of renal dysfunction. In group A, 27.1% of patients and in group B 23.4% of patients were considered urgent.
Baseline characteristics of patients referred for cardiac surgery.
| Group A | Group B | Total | p | |
|---|---|---|---|---|
| Age | 66.1±11.7 | 65.8±11.5 | 66.0±11.6 | 0.68 |
| Male | 67.6% | 72.2% | 69.3% | 0.09 |
| BMI | 27.1±5.2 | 27.2±4.7 | 27.1±5.0 | 0.78 |
| Hypertension | 68.6% | 70.6% | 69.3% | 0.64 |
| Diabetes | 25.9% | 25.2% | 25.5% | 0.45 |
| Dyslipidemia | 57.7% | 65.5% | 60.5% | 0.03 |
| Smoking | 31.1% | 29.1% | 30.4% | 0.29 |
| Ejection fraction | 64.6±12.2 | 63.2±11.8 | 64.1±12.1 | 0.10 |
| EuroSCORE | 6.2±6.4 | 5.7±5.4 | 6.0±6.0 | 0.36 |
| Renal failure stage | 0.28 | |||
| 3 | 22.9% | 19.2% | 21.5% | |
| 4 | 3.9% | 1.4% | 3.0% | |
| 5 | 1.0% | 1.9% | 1.3% | |
| Urgent indication | 27.1% | 23.4% | 25.8% | 0.13 |
| Waiting time, days (total) | 10.6±18.5 | 55.7±79.9 | 26.6±54.2 | 0.00 |
| Urgent | 2.1±2.5 | 3.0±3.2 | 2.4±2.8 | 0.03 |
| Elective | 13.8±20.8 | 72.4±85.1 | 35.1±60.7 | 0.00 |
| Type of surgery | ||||
| CABG | 38.2% | 41.8% | 39.5% | 0.17 |
| AoV replacement | 23.9% | 25.6% | 24.5% | 0.31 |
| MV surgery | 10.4% | 12.0% | 11.4% | 0.27 |
| Combined | 19.4% | 13.9% | 17.4% | 0.02 |
| Other | 8.1% | 6.6% | 7.6% | 0.26 |
AoV: aortic valve; BMI: body mass index; CABG: coronary artery bypass grafting; Combined: combined valve and coronary surgery; MV: mitral valve.
The mean waiting time for surgery was 10.6±18.5 days (median 6.0, maximum 279 and minimum 0) in group A and 55.7±79.9 days (median 18.0, maximum 476 and minimum 0) in group B (p=0.00). The difference was significant both for patients with indication for urgent surgery (2.1 days in group A and 3.0 days in group B, p=0.03) and for patients referred for elective surgery (13.8 days in group A and 72.4 days in group B, p=0.000).
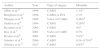
With regard to indications for surgery, there were also no statistically significant differences between the groups (Table 1). As shown in Table 2, there were differences in waiting times for the various types of surgical indication, with a mean waiting time for CABG of 8.0±8.8 days (median 6, maximum 59 and minimum 1) in group A and 57.2±76.0 days (median 20, maximum 352 and minimum 0) in group B (p=0.00). Among patients referred for aortic valve replacement, in group A the mean waiting time was 14.0±15.8 days (median 10.0, maximum 100 and minimum 0), while in group B the mean was 90.5±86.9 days (median 68.5, maximum 363 and minimum 0) (p=0.00). For mitral valve replacement, the mean in group A was 12.6±11.9 days (median 12.6, maximum 67 and minimum 0) and in group B 63.3±81.8 days (median 25.0, maximum 338 and minimum 0) (p=0.00). Patients in group A scheduled for combined surgery waited a mean of 14.5±30.1 days (median 8.0, maximum 279 and minimum 0) and those in group B waited a mean of 59.3±97.2 days (median 20.0, maximum 476 and minimum 0) (p=0.00)
Mean waiting time for cardiac surgery in the two groups.
| Group A | Group B | p | |
|---|---|---|---|
| Non-urgent CABG | 8.0±8.8 | 57.2±76.0 | 0.00 |
| AoV replacement | 14.0±15.8 | 90.5±86.9 | 0.00 |
| MV replacement | 12.6±11.9 | 63.3±81.8 | 0.00 |
| Combined | 14.5±30.1 | 59.3±97.2 | 0.00 |
| Other | 13.1±27.0 | 31.0±49.9 | 0.06 |
AoV: aortic valve; CABG: coronary artery bypass grafting; Combined: combined valve and coronary surgery; MV: mitral valve.
Table 3 shows the percentages of patients operated within the times recommended in international guidelines.20,21 The differences observed are statistically significant for the different types of surgery.
During the waiting period two patients (0.4%) were hospitalized in group A and 28 (9.1%) in group B (p=0.00). There were no deaths during the waiting period in group A but seven in group B (0% vs. 2.3%, p=0.00). The patients who died had waited for a mean of 72.6 days (median 47, minimum 13 and maximum 195); one of them was indicated for urgent surgery. Surgical indications in the patients who died were CABG in one, aortic valve replacement in three, mitral valve replacement in one and combined valve and coronary surgery in one. Kaplan-Meier survival curves for event-free survival (death or hospitalization) and for death-free survival during the waiting period in group A and group B are shown in Figures 1 and 2, respectively.
 of patients awaiting cardiac surgery in group A and group B.")

Of the 755 patients referred between January 1, 2008 and October 31, 2013 for whom one-year follow-up was possible, this was achieved in 641 (85%). During this period, 12.8% of these patients, 16% of those in group A and 12.9% of those in group B (p=0.2), were hospitalized for cardiovascular causes. Cardiovascular mortality during follow-up was 4.8%, 4.7% in group A and 5.1% in group B (p=0.49). Figures 3 and 4 show Kaplan-Meier curves for event-free survival (death or hospitalization) and death-free survival at one year of follow-up, respectively.
 of patients at one year of follow-up in group A and group B.")

This is the first study in Portugal analyzing the impact of waiting times for cardiac surgery on mortality, need for hospitalization before surgery and early and one-year outcomes.
The study shows that the changes in referral protocols for patients with indication for cardiac surgery at Hospital de Faro that took effect in August 2011 significantly increased waiting times and mortality during the waiting period. This increase was seen for all types of cardiac surgery, and was statistically significant for CABG, aortic and mitral valve replacement, and combined surgery.
The importance of waiting times for cardiac surgery has been the subject of considerable debate. In 1995, Carroll et al. reported large differences between certain European countries and the USA, with most CABG being performed within 72 hours in the USA, while in the UK most patients waited more than three months.14 There has also been disagreement concerning the definition of surgical wait times. According to the Organisation for Economic Co-operation and Development, the wait time should include the time the patient actually waits for surgery, including the time waiting for the first consultation, for diagnostic exams, and, finally, for the procedure itself.15,16 Various studies have suggested that all of these waiting time intervals need to be addressed in order to reduce total waiting time and improve the health care provided to patients.15
In Canada, where this issue has been studied most, the Ontario score17 was created to develop guidelines for ranking the urgency with which patients with angiographically proven coronary disease need revascularization procedures.18 This score classifies patients as emergency (immediate revascularization), extremely urgent (within 24 hours), urgent (24–72 hours), semi-urgent (72 hours–14 days), short list (2–6 weeks), delayed (6 weeks–3 months), and/or marked delay (3–6 months).
The Wait Time Alliance is a Canadian organization formed by various medical societies, dedicated to reducing waiting times for medical care in Canada. Its benchmarks for waiting time for CABG are 24 hours for emergency cases, seven or 14 days for urgent cases, and six weeks for elective surgery.19 The Access to Care Working Group of the Canadian Cardiovascular Society (CCS) has also defined waiting times for cardiac surgery, suggesting 14 days or six weeks for CABG, depending on coronary anatomy, 14 days for severe aortic stenosis and six weeks for other valve surgery.20
In our study, waiting times for non-urgent CABG increased from eight to around 57 days, with some patients waiting over three months, and similar increases were seen for valve and combined surgery. Although the times referred to in the above studies reflect the situation in Canada, they are the only guidelines specifically on this subject. The 2014 ESC/EACTS Guidelines on myocardial revascularization21 also present recommendations for optimal timings for intervention: revascularization (percutaneous coronary intervention or CABG) should be performed within two weeks for patients with CCS class 3 or 4 symptoms or high-risk anatomy (left main disease or equivalent, three-vessel or proximal LAD disease or depressed ventricular function), and within six weeks for all other patients with stable coronary disease.
Our findings (Table 3) show that waiting times for patients referred by our center for cardiac surgery are longer than the above recommendations.
Increased wait time for CABG increases mortality during the waiting period.1,22 In our study, cardiovascular mortality in a mean waiting period of 55.7±79.9 days was 2.3% (group B), while in group A the mean waiting time was 10.6±18.5 days and there were no deaths between diagnosis and surgery. In the seven patients who died waiting for surgery, mean waiting time was 72.6 days (median 47, maximum 195 and minimum 13). These findings are also illustrated in Figure 2.
There are several studies in the literature describing mortality rates in patients waiting for cardiac surgery, the figures ranging between 0.3% and 5.8% (Table 4).
Studies on mortality in patients awaiting cardiac surgery.
| Author | Year | Type of surgery | Mortality |
|---|---|---|---|
| Silber et al.13 | 1996 | CABG | 1.3%a |
| Bengtson et al.2 | 1996 | CABG or PCI | 2.1% |
| Morgan et al.18 | 1998 | Valve or CABG | 0.48%b |
| Seddon et al.4 | 1999 | CABG | 0.28%c |
| Koomen et al.7 | 2000 | CABG | 4%a |
| Ray et al.6 | 2001 | Valve or CABG | 0.7% |
| Rexius et al.8 | 2004 | CABG | 5.8%a |
| Sobolev et al.9 | 2006 | CABG | 0.58–0.79%d |
| Sobolev et al.22 | 2013 | CABG | 0.9%d |
CABG: coronary artery bypass grafting; PCI: percutaneous coronary intervention.
Although most studies on waiting times are on CABG, Lund et al. showed that mortality in patients with symptomatic aortic stenosis awaiting valve replacement was 13.5% during a mean waiting period of 6.3 months.23 More recently, Malaisrie et al. showed that mortality in patients with aortic stenosis waiting for valve replacement was 3.7% at one month and 11.6% at six months.24 In another recent study, in patients with severe aortic stenosis, abrupt symptomatic deterioration from New York Heart Association (NYHA) class I to NYHA III–IV in the month preceding surgery was observed in 18% of patients, resulting in increased operative mortality (17% vs. 5% in NYHA I patients (p=0.035) and significantly worse long-term survival in patients in NYHA III–IV (56% vs. 72%; p<0.002).25
It has also been shown that in patients with severe aortic stenosis who are inoperable or at high surgical risk, increased time waiting for percutaneous valve replacement is associated with higher mortality both while on the waiting list and at one year.26
Although our study was not designed to establish costs, hospitalizations incur additional costs. Besides higher mortality, increased waiting times in our patients were associated with a significant rise in the number of hospitalizations (from 0.4% to 9.1%) during the waiting period. The differences between the two groups in mortality and hospitalizations can be seen in the survival curves in Figure 1. In our study population, most of these admissions were due to worsening clinical status requiring earlier surgery and hospitalization in the interim.
Waiting times for cardiac surgery of over three months have also been associated with a greater number of adverse events following surgery.26 No such association was seen in our study, in which the prevalence of hospitalization (12.9% vs. 16%) and mortality (4.7% vs. 5.1%) were similar in the two groups at one year, as shown in Figures 3 and 4.
As stated above, in Canada the subject of waiting lists is the subject of considerable debate, and it has been suggested that additional financial investment can help reduce waiting times.27
It can be seen from our study that longer waiting times for surgery lead to increases in hospitalizations and mortality. The available data do not allow ideal waiting times to be identified and, in any case, this was not the aim of the study. We therefore propose the establishment of a national database of patients referred for cardiac surgery, in order to quantify the adverse events that occur during the waiting period. On the basis of such objective data it will be possible to modify the referral process in order to eliminate excessive waiting times and their harmful consequences.
LimitationsThe main limitations of the study stem from its retrospective and observational nature and the fact that it is based on a single referral center.
A follow-up rate of 85% was achieved, which while acceptable given the number of patients, may have underestimated the event rate (hospitalization and mortality) during the follow-up period.
The definition of waiting time in this study was the interval between the date of surgery and the date of referral, which may underestimate the real waiting time as experienced by the patient, and this could lead to bias.
ConclusionThe changes in referral protocols for cardiac surgery, although not associated with increased one-year mortality, did result in a statistically significant increase in waiting time and hence to a rise in mortality and hospitalizations during the waiting period of 0% to 2.3% and 0.4% to 9.1%, respectively.
Ethical responsibilitiesProtection of people and animalsThe authors declare that no experiments were performed on humans or animals for this study.
Data confidentialityThe authors declare that they have followed the protocols of their work center on the publication of patient data.
Right to privacy and informed consentThe authors declare that no patient data appear in this article.
Conflicts of interestThe authors have no conflicts of interest to declare.
Please cite this article as: Amado J, Bento D, Silva D, Chin J, Marques N, Gago P, et al. Alteração nas redes de referenciação de doentes para cirurgia cardiotorácica: as razões económicas serão destituídas de custos? 2015;34:575–581.
