


Studies in adults have shown an association between increased adiposity and hypertension, but few studies have analyzed this association in childhood. The aim of this study was to investigate the association between blood pressure (BP) and body adiposity indicators in children, controlling for the variables of birth conditions, sociodemographics, lifestyle and diet.
MethodsIn this cross-sectional study of 399 children aged 4 to 7 years, the dependent variable was BP, measured according to the protocol established by the 7th Brazilian Guidelines on Hypertension. The explanatory variables of the study were waist-to-height ratio (WHtR) and body mass index (BMI). Multiple linear regression was used to assess the independent association between adiposity and BP indicators adjusted for the variables of birth conditions, sociodemographics, lifestyle and diet. Statistical significance was set as α=5%.
ResultsBMI for age and WHtR correlated positively with systolic (SBP) and diastolic blood pressure (DBP). After multivariate analysis, higher values of BMI (model 1) and WHtR (model 2) were associated with increased SBP and DBP.
ConclusionIncreased body adiposity, as assessed by BMI and WHtR, was associated with increased SBP and DBP among the children studied. Thus, we suggest the use of BMI and WHtR in the nutritional assessment of children to detect changes in BP and other cardiometabolic risk factors in this population.
Estudos feitos com adultos têm demonstrado associação entre aumento da adiposidade corporal e hipertensão arterial, mas ainda são escassos estudos que avaliaram essa associação na infância. O objetivo deste estudo foi investigar a associação entre pressão arterial e indicadores de adiposidade corporal em crianças, controlada por variáveis de nascimento, sociodemográficas, de estilo de vida e dietéticas.
MétodosEstudo transversal com amostra de 399 crianças de quatro a sete anos. A variável dependente foi a pressão arterial, aferida de acordo com protocolo estabelecido pela VII Diretriz Brasileira de Hipertensão Arterial. As variáveis explicativas do estudo foram os índices relação cintura-estatura (RCE) e índice de massa corporal (IMC). A regressão linear múltipla foi usada para avaliar a associação independente entre indicadores de adiposidade e pressão arterial, ajustada por variáveis de nascimento, sociodemográficas, estilo de vida e alimentação das crianças. Considerou-se como significância estatística α=5%.
ResultadosO IMC/I e a RCE correlacionaram-se positivamente com a pressão arterial sistólica e diastólica. Após as análises múltiplas, os maiores valores de IMC (modelo 1) e RCE (modelo 2) se associaram ao aumento da pressão arterial sistólica e diastólica.
ConclusãoO aumento da adiposidade corporal, avaliada pelo IMC e pela RCE, associou-se ao aumento da pressão arterial sistólica e diastólica entre as crianças avaliadas. Assim, sugere-se o uso do IMC e da RCE na avaliação nutricional de crianças, para screening de alterações na pressão arterial e outros fatores de risco cardiometabólico nessa população.
Hypertension is an independent, linear and continuous risk factor for cardiovascular disease. It can also lead to various other disorders, including cerebrovascular disease, coronary artery disease, heart failure, chronic renal failure and peripheral vascular disease.1 According to data published by the World Health Organization (WHO), in 2012 there were about 600 million people with hypertension worldwide, with similar prevalences in developed and developing countries.2
Studies have shown that hypertension can begin early in life, and that elevated blood pressure (BP) tracks from childhood to adulthood.3,4 According to a systematic review, the prevalence of high BP in children and adolescents worldwide ranges between 0.46% and 20.3%.5 Essential HT (with no identifiable cause) in childhood may be the result of interactions between genetic and environmental factors, such as familial hypertension, birth conditions, nutritional status, diet and lifestyle.6–8
The significant changes in dietary and nutritional patterns in contemporary populations are seen as part of a process called the nutrition transition.2,9 In this view, the high prevalence of overweight and adiposity in children is directly related to the increased prevalence of essential HT in childhood.6,10 Among the mechanisms put forward to explain this relationship are abnormal insulin metabolism, increased sympathetic tone, structural and functional vascular alterations, increased platelet aggregation and oxidative insult, in addition to sleep disorders.11
Despite their limitations, measurement of anthropometric indicators to assess nutritional status have become the most practical and least expensive way to assess both individuals and populations, whether for clinical interventions, for screening purposes, or for monitoring trends.12 Body mass index (BMI) and waist circumference, as well as derived indices such as the waist-to-height ratio (WHtR), are the most commonly used parameters in studies assessing nutritional status and adiposity, and are associated with various cardiovascular risk factors, including high BP.6,13,14
Few studies have assessed the relationship between easily measured and low-cost body adiposity indicators, such as BMI and WHtR, and BP in children. In most studies the samples have broad age ranges, including adolescents, which makes it difficult to assess and interpret this relationship in children.8,13,15
In view of the above, the aim of this study was to assess the association between body adiposity indicators and BP in children, controlling for the variables of birth conditions, sociodemographics, lifestyle and diet.
MethodsThis was a cross-sectional study of children from a retrospective birth cohort at the only maternity hospital in Viçosa, Minas Gerais, Brazil. The children were monitored via the Programa de Apoio à Lactação (Breastfeeding Support Program, PROLAC) during the first year of life and reassessed at 4-7 years of age. PROLAC is an extension program of the Universidade Federal de Viçosa (UFV), in partnership with Hospital São Sebastião and the Human Milk Bank of Viçosa municipality. The program primarily gives guidance to postpartum mothers, aiming to promote breastfeeding and nutritional care for nursing mothers and infants during the first year of life.
The following criteria were used for enrollment in the study: identification data in the PROLAC care records that enabled the child to be located; date of birth showing age between 4 and 7 years at the time of the study; and written consent from parents or guardians to participate. The exclusion criterion was the presence of health disorders or use of medication that might affect the child's body composition or BP. At least three attempts were made to contact the children's parents or guardians at home. The final sample consisted of 399 children.
The power of the study was calculated using the means and standard deviations of systolic blood pressure (SBP) in children who were not overweight (94.92±8.03 mmHg) and in those who were overweight (101.14±9.58 mmHg); for a significance level of 5%, the study had a power of 100%. OpenEpi online software was used for the calculation.
All assessments were conducted in the nutrition unit of the Health Division of UFV. SBP and diastolic blood pressure (DBP) were measured in accordance with the protocol established by the 7th Brazilian Guidelines on Hypertension.16 An automatic blood pressure monitor (Omron® HEM-741 CINT) was used, as recommended by the Brazilian Society of Cardiology. Three measurements were taken, with an interval of at least 1 min, and the mean of the last two was used for the analysis.
Weight, height and waist circumference were measured to determine the children's nutritional status. Weight was determined with an electronic digital scale with a capacity of 150 kg and precision of 10 g. Height was measured using a wall-mounted stadiometer 2 m in height, divided into mm. The measurements were taken in accordance with the WHO guidelines.17 Overweight was classified by BMI for age according to gender, using a z-score ≥1 as cutoff, as recommended by the WHO.18
Waist circumference was measured at the level of the navel using a 2-m flexible non-stretching tape measure divided into mm.19 Three measurements were taken, and the mean of the two closest values was used in the analysis. WHtR was calculated as the ratio of waist circumference in cm to height in cm; values >0.5 were considered a cardiometabolic risk factor.20
Data on birth weight, whether the child was exclusively breastfed in the first four months of life, and duration of breastfeeding were obtained from PROLAC care records.
Sociodemographic information was obtained from a semi-structured questionnaire applied to the child's parent or guardian, including gender, age, mother's level of education (<8 or >8 years) and per capita income (classified in tertiles). The child's parent or guardian was also asked whether either parent had a history of hypertension.
Information on lifestyle was obtained using a questionnaire adapted from Andaki et al.21 Lifestyle variables included time per day spent watching television (<2 hours or ≥2 hours) and time per day spent in sedentary play (including computer and video games, playing with strollers and dolls, and school activities) and in active play (including riding a bicycle, playing ball, and running).
The parent or guardian was also asked how often each week the child usually ate foods from the fruit and vegetable groups. For the analysis, consumption of these food groups was categorized according to median frequency (fruit: five times a week; vegetables: six times a week).
Statistical analysisThe distribution of variables was assessed using the Shapiro-Wilk test for normality and histogram analysis, assuming symmetry of data when the normality test was not significant and the coefficient of asymmetry (skewness) was between -0.5 and +0.5.22
A descriptive analysis was performed using measurements of distribution of frequencies, central tendency, and dispersion (median, minimum and maximum). The Mann-Whitney and Kruskal-Wallis tests were used to detect differences in median SBP and DBP between explanatory variables, and Spearman's test was used to assess the correlation of BMI and WHtR with blood pressure.
The regression coefficient and confidence interval were estimated using bivariate linear regression analysis, and variables with a p-value <0.20 were included in the multivariate analysis. Log transformation of dependent variables (SBP and DBP) was performed for the linear regression analysis.
The normality of the distribution of residuals (which should be normally distributed) was assessed to check the adequacy and fit of the linear regression model. White's test was used to check for heteroscedasticity. The variance inflation factor was used in the multivariate regression analysis as an indicator of multicollinearity. Analyses were performed using Stata version 13.0 software. Statistical significance was set at α=0.05.
The study was approved by UFV's ethics committee for human research (ref. 892476/2014). Only children whose parents or guardians had provided written informed consent were enrolled in the study.
ResultsOf the 399 children assessed, 54.6% were male, and mean age was 5.99±0.99 years. Most had a birth weight ≥3000 g (69%) and were exclusively breast fed until four months of age (60.7%). Of their mothers, 65.1% had more than eight years of schooling and 34.3% had a per capita income below 255 Brazilian reals. Among the children, the prevalence of overweight was 25.8% and 23.7% had abnormal WHtR. Fruit was eaten five or more times per week by 53.3% and vegetables six or more times per week by 53.1% (Table 1).
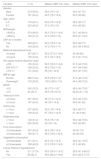
Median, minimum and maximum systolic and diastolic blood pressure in the study population according to sociodemographic and anthropometric variables, birth conditions and lifestyle.
| Variable | n (%) | Median SBP (min-max) | Median DBP (min-max) |
|---|---|---|---|
| Gender | |||
| Male | 218 (54.6) | 96.5 (76-113) | 59.0 (41-76) |
| Female | 181 (45.4) | 94.5 (78-114.8) | 60.0 (40-80) |
| Age, years | |||
| 4-5 | 176 (44.1) | 94.0 (76-114.8)* | 58.5 (40-77)* |
| 6-7 | 223 (55.9) | 97.0 (79-113) | 60.0 (45-80) |
| Birthweight | |||
| >3000 g | 274 (69.0) | 95.5 (76.5-114.8) | 59.7 (40-80.5) |
| <3000 g | 123 (31.0) | 97.0 (78.5-113) | 59.5 (41-73.5) |
| EBF for 4 months | |||
| Yes | 238 (60.7) | 95.5 (76.5-114) | 58.5 (40-77) |
| No | 154 (39.3) | 97.2 (78.5-111) | 60.5 (44.5-80.5) |
| Maternal educational level | |||
| >8 years | 257 (65.1) | 95.5 (77.5-114.8) | 59 (40-80) |
| <8 years | 138 (34.9) | 97.0 (76-112.5) | 61.0 (41-73.5) |
| Per capita income, Brazilian reals | |||
| <255 | 135 (34.3) | 96.5 (78.5-114.8) | 61.0 (40-73.5) |
| 255-475.17 | 128 (32.5) | 96.2 (78.5-112) | 59.7 (44.5-80) |
| >475.17 | 131 (33.2) | 95 (76-112.5) | 58.5 (41-73.5) |
| BMI for age | |||
| Normal | 296 (74.2) | 95.5 (76.5-114)** | 57.5 (40-73.5)** |
| Overweight | 103 (25.8) | 100.5 (85.5-113) | 64.0 (49-73.5) |
| WHtR | |||
| <0.5 | 303 (76.3) | 95 (77.5-113)** | 58.0 (40-73.5)** |
| >0.5 | 94 (23.7) | 99.5 (76-161.5) | 62.25 (41-115) |
| Television time | |||
| <2 hours | 201 (50.5) | 96 (77.5-112.5) | 59.0 (40-73.5) |
| >2 hours | 197 (49.5) | 96 (76-114.8) | 60.0 (41-93) |
| Active play | |||
| >1 hour | 237 (59.8) | 95.5 (76-114.8) | 58.5 (40-77)* |
| <1 hour | 159 (40.2) | 97 (78.5-112.5) | 61 (44.5-80) |
| Sedentary play | |||
| <1 hour | 148 (37.2) | 95.5 (76-113) | 59.0 (40-73.5) |
| >1 hour | 250 (62.8) | 96 (78-114) | 60.0 (45-80) |
| Fruit consumption | |||
| >5 times/week | 207 (53.3) | 95.5 (78-112.5) | 59 (41-73) |
| <5 times/week | 189 (47.7) | 96.5 (76.5-116.5) | 60 (40-93) |
| Vegetable consumption | |||
| >6 times/week | 211 (53.1) | 95.5 (76-112.5) | 58.5 (41-73.5)* |
| <6 times/week | 186 (46.9) | 97.0 (78.5-114.8) | 61.0 (40-80) |
| Family history of hypertension | |||
| No | 311 (77.9) | 95.0 (76.5-113.0)** | 58.5 (41.0-80.0)** |
| Yes | 88 (22.1) | 99.2 (85.0-114.8) | 63.0 (40.0-77.0) |
Children between 6 and 7 years of age (p=0.001) who were overweight (p<0.001) and had abnormal WHtR (p<0.001) had higher median SBP and DBP than their peers. Children with higher median DBP were older (p=0.002) and were more likely to be overweight (p<0.001) and to have abnormal WHtR (p<0.001), spent less than one hour per day in active play (p=0.011) and ate vegetables less than six times per week (p=0.007) (Table 1). A positive correlation was found between BMI and WHtR and SBP and DBP (Table 2).
Children aged 6 and 7 with higher BMI and WHtR and lower weekly consumption of vegetables had higher SBP and DBP. In addition, less active play (<1 hour per day) was associated with higher DBP (Table 3).
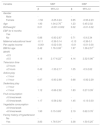
Coefficients of simple linear regression and confidence intervals for the association of systolic and diastolic blood pressure with sociodemographic and anthropometric variables, birth conditions and lifestyle in the study population.
| Variable | SBP | DBP | ||
|---|---|---|---|---|
| β | 95% CI | β | 95% CI | |
| Gender | ||||
| Male | - | - | ||
| Female | -1.50 | -3.25-0.24 | 0.65 | -0.93-2.23 |
| Age | 1.90 | 1.04-2.76** | 1.23 | 0.45-2.02 |
| Birthweight | 0.01 | -0.001-0.002 | 0.02 | -0.01-0.02 |
| EBF for 4 months | ||||
| Yes | - | - | ||
| No | 0.86 | -0.93-2.67 | 0.71 | -0.9-2.34 |
| Maternal educational level | -0.11 | -0.36-0.14 | -0.13 | -0.36-0.1 |
| Per capita income | -0.001 | -0.02-0.00 | -0.01 | -0.01-0.00 |
| BMI for age | 2.42 | 1.76-3.08** | 1.97 | 1.36-2.57** |
| WHtR | ||||
| <0.5 | - | - | ||
| >0.5 | 4.19 | 2.17-6.22** | 4.14 | 2.32-5.96** |
| Television time | ||||
| <2 hours | - | |||
| >2 hours | 0.42 | -1.33-2.17 | 1.05 | -0.5-2.62 |
| Active play | ||||
| <1 hour | - | - | ||
| >1 hour | 0.87 | -0.93-2.68 | 0.68 | -0.92-2.29 |
| Sedentary play | ||||
| >1 hour | - | - | ||
| <1 hour | 1.12 | -0.66-2.92 | 1.83 | 0.27-3.39* |
| Fruit consumption | ||||
| >5 times/week | - | - | ||
| <5 times/week | 1.17 | -0.58-2.92 | 1.45 | -0.13-3.03 |
| Vegetable consumption | ||||
| >6 times/week | - | - | ||
| <6 times/week | 1.90 | 0.15-3.65* | 2.19 | 0.62-3.76* |
| Family history of hypertension | ||||
| No | - | - | ||
| Yes | 3.83 | 1.76-5.91** | 3.38 | 1.50-5.25* |
After multivariate linear regression analysis, higher BMI was still independently associated with higher BP in model 1 (BMI as the main explanatory variable). The same was found for model 2 (WHtR as the main explanatory variable), in which abnormal WHtR values was associated with increased SBP and DBP (Table 4).
Final multivariate linear regression models for systolic and diastolic blood pressure according to body mass index and waist-to-height ratio in the study population.
| Models | β | 95% CI | p | R2 |
|---|---|---|---|---|
| SBPa,c | ||||
| BMI for age | 1.91 | 1.25-2.57 | <0.001 | 0.185 |
| SBPb,c | ||||
| WHtR ≥0.5 | 3.98 | 2.04-5.92 | <0.001 | 0.150 |
| DBPa,d | ||||
| BMI for age | 1.65 | 1.04-2.27 | <0.001 | 0.132 |
| DBPb,d | ||||
| WHtR ≥0.5 | 3.82 | 2.05-5.60 | <0.001 | 0.113 |
Adjusted for gender, age, height, frequency of fruit consumption, frequency of vegetable consumption, and family history of hypertension.
Adjusted for gender, age, height, frequency of fruit consumption, television time, active play, frequency of vegetable consumption, and family history of hypertension.
β: linear regression coefficient; BMI: body mass index; DBP: diastolic blood pressure; EBF: exclusive breastfeeding; R2: coefficient of determination; SBP: systolic blood pressure; WHtR: waist-to-height ratio.
BP is not commonly measured in children. In this study we found that increased adiposity indicators (BMI and WHtR) were associated with higher SBP and DBP in these children, even after adjustment for other variables associated with BP. These findings are consistent with other studies13,14 and highlight the importance of assessing body adiposity in clinical practice as a predictor of risk of hypertension in children.
In a case-control study in preschool Chinese children matching obese and nonobese pairs, the mean BP differences between the pairs were approximately 5 mmHg for SBP and 4 mmHg for DBP. The highest levels were in overweight children. BP levels were higher than the 95th percentile in 19.4% of the children in the obese group, compared to only 7% of children in the normal BMI group.23 A different result was obtained in a study by Sarni et al.24 of preschoolers in São Paulo, Brazil, in which, although strong correlations were found between BMI, waist circumference and other anthropometric parameters, there was no association between high BP and overweight. The authors explained this result in terms of the young age-group studied and the small sample. In our study, although the children studied were also young (4-7 years), those with higher BMI and WHtR already had higher BP levels.
The prevalence of overweight children in this study was 25.8%, which is greater than in other studies in the pediatric population.8,25 According to the 2008-2009 Pesquisa de Orçamentos Familiares (Family Budget Survey),9 33.5% of Brazilian children aged 5-9 years are overweight, and 16.6% of all boys and 11.8% of all girls are obese. Moreover, the proportion of underweight children in the same age group was lower in all regions, around the national average of 4%. This illustrates the nutrition transition that is underway in Brazil, including in the pediatric population.9
Excess body fat may be distributed in a generalized and/or localized manner, and so a diagnosis of overweight must take into account not only total body fat, but also its distribution.20 Accumulation of abdominal fat reflects deposition of fat around the viscera, which promotes lipolysis in cells and the release of free fatty acids into the bloodstream, increasing risk for atherosclerotic disease. This type of fat deposit also plays a part in the development of dyslipidemia, insulin resistance, glucose intolerance and hypertension, the characteristics of metabolic syndrome.1 Thus, abdominal adiposity indicators such as WHtR enable cardiometabolic risk to be assessed independently of body weight.
BMI was included as a continuous variable in linear regression analysis and continued to be associated with increased SBP and DBP. This is in agreement with other studies which report that higher BMI, and not only overweight, is related to increased BP. These findings suggest that assessing BMI as a continuous variable will better predict hypertension risk.26
In simple linear regression analysis, spending less than one hour per day in active play was positively associated with DBP (p=0.021), but after adjustment for other variables in the multivariate model, this association was not seen. In recent decades, technological advances have led children to become less active and more sedentary, with increasing time spent on computers and watching television. This behavior has a positive correlation with body adiposity and associated childhood diseases.27
On multivariate analysis, body adiposity indicators were still independently associated with SBP and DBP. Models relating BMI and WHtR with SBP and DBP had similar coefficients of determination, demonstrating that these indicators are similar in their explanation of BP changes in the study subjects. Given that WHtR and BMI are easy to assess and interpret, we recommend their use in epidemiological studies and in clinical practice to screen for children at risk of cardiometabolic disorders such as hypertension.
It should be noted that, although in this study the proposed WHtR cutoff for cardiometabolic risk was 0.5, regardless of age, some studies have found lower values, the majority of them below 0.5, to be predictors of cardiometabolic disorders.28,29 A study of children and adolescents in Iran identified cutoff points of 0.40 for boys and 0.42 for girls.30 In this study, values >0.5 were associated with higher median BP than lower values. Further studies with Brazilian children should be conducted to determine whether this is the best cutoff or whether it underestimates the proportion of at-risk children.
Although it was not among the study's objectives, multivariate analysis revealed that children who consumed vegetables less than six times a week had higher SBP and DBP. Epidemiological studies have shown the importance of fruit and vegetable consumption for promoting health and preventing chronic non-communicable diseases.31,32 Encouraging children to consume these foods – considered markers of a healthy diet – is crucial because childhood eating habits tend to continue into adulthood.
Atherosclerotic disease may start in childhood and progress with age, and its severity is directly proportional to the number of risk factors present. Primary prevention of cardiometabolic disorders such as hypertension should therefore start at a young age. It is recommended that BP should be measured in outpatient care starting at age 3,1 but this rarely occurs in children and adolescents, demonstrating that this procedure has not yet been put into clinical practice.33
Study limitationsAs this was a cross-sectional study, a causal relationship could not be established between body adiposity and increased BP. Another limitation was the lack of information on the consumption of other foods that affect blood pressure, such as ultra-processed foods and those with added salt.
ConclusionIncreased body adiposity, as assessed by BMI and WHtR, was associated with higher SBP and DBP in the children studied, even after adjustment for other variables. The use of adiposity indicators such as BMI or WHtR is recommended to screen for children at risk of abnormal BP and other metabolic disorders.
We also highlight the importance of maintaining an appropriate nutritional status and healthy lifestyle from childhood, since this is crucial to reduce the prevalence of cardiometabolic risk factors throughout life.
Conflicts of interestThe authors have no conflicts of interest to declare.
We would like to thank the children who participated in this project and their parents and guardians. We would also like to thank Capes for their doctoral scholarship grant. This project received financial support from FAPEMIG and CNPq.
Please cite this article as: Vieira SA, Fonseca PC, Andreoli CS, et al. A pressão arterial está associada a indicadores de adiposidade corporal em crianças de quatro a sete anos. Rev Port Cardiol. 2018;37:425–432.
