
Patients with coronary artery disease (CAD) are at increased risk of stroke. The aim of this study was to analyze the prognostic accuracy of selected clinical and laboratory variables in stroke risk prediction following discharge after myocardial infarction (MI).
Methodswe analyzed 404 consecutive patients (aged 68.1±13.7 years; 63.4% male; 37.4% with diabetes) without previous stroke who were discharged in sinus rhythm after being admitted for MI. The following data were collected: cardiovascular risk factors, admission blood glucose (BG), HbA1c, creatinine, peak troponin levels; glomerular filtration rate (GFR) by the MDRD formula; maximum Killip class; GRACE score for in-hospital and 6-month mortality; and extent of CAD. Patients were followed for two years and each variable was tested as a possible predictor of cerebrovascular events (stroke or transient ischemic attack [TIA]).
ResultsDuring follow-up, 27 patients were admitted for stroke or TIA. The presence of diabetes, hypertension, dyslipidemia and previously known CAD, type of MI (STEMI vs NSTEMI) and extent of CAD did not predict cerebrovascular risk. The following variables were associated with higher stroke risk: GFR <60ml/min/m2 (p=0.029, OR 2.65, 95% CI 1.07–6.55); maximum Killip class >1 (p=0.025, OR 2.71, 95% CI 1.10-6.69); GRACE in-hospital mortality >180 (p=0.001, OR 4.09, 95% CI 1.64-10.22); admission BG >140mg/dl (p=0.001, OR 5.74, 95% CI 1.87-17.58); GRACE 6–month mortality >150 (p=0.001, OR 4.50, 95% CI 1.80-6.27); and peak troponin >42ng/ml (p=0.032, OR 2.64, 95% CI 1.06-6.59). Logistic regression analysis produced a model with the predictors GRACE 6-month mortality >150 (OR 3.26; p=0.014) and admission BG >7.7mmol/l (OR 4.09; p=0.017) that fitted the data well (Hosmer-Lemeshow: p=0.916).
Discussion/ConclusionsIn patients with MI, variables known to be predictors of in-hospital mortality, including admission BG, renal function, acute heart failure and GRACE score, were found to be useful predictors of stroke during 2-year follow-up. While both GRACE score for 6-month mortality >150 and admission BG >7.7mmol/l were independent predictors of stroke, CV risk factors, previously known CAD, and extent of CAD assessed by coronary angiography did not improve stroke risk prediction. This study highlights the need for even more aggressive secondary prevention in patients most at risk.
Doentes com doença coronária (DC) têm risco aumentado de acidente vascular cerebral (AVC). O objectivo deste estudo foi analisar o poder prognóstico de determinadas variáveis clínicas e analíticas na predição do risco de evento cerebrovascular (CBV) após enfarte agudo do miocárdio (EAM).
População e métodos404 doentes consecutivos (idade média 68,1±13,7, 63,5% do sexo masculino, 37,4% com diabetes mellitus [DM]) sem antecedentes de AVC admitidos com o diagnóstico de EAM e que sobreviveram ao internamento. Dados recolhidos: factores de risco cardiovascular (CV), glicemia na admissão (GlicAd), HbA1c, creatinina, níveis máximos de troponina I (MaxTrop), taxa de filtração glomerular (TFG) calculada pelas fórmulas MDRD e Cockcroft-Gault, GRACE score para mortalidade intra-hospitalar e aos 6 meses (MIH e M6M, respectivamente), Killip Class máximo (KCm) e extensão da coronariopatia. Os doentes tiveram alta em ritmo sinusal, foram seguidos por dois anos e cada variável avaliada como possível preditor de AVC ou acidente isquémico transitório (AIT).
ResultadosDurante o follow-up, 27 doentes foram admitidos por evento cerebrovascular. A presença de DM, hipertensão, dislipidemia e DC prévia, o tipo de EAM (STEMI versus NSTEMI) e a extensão da coronariopatia não ajudaram a prever o risco de AVC/AIT. As seguintes variáveis associaram-se a maior risco de AVC/AIT: TFG <60ml/min/m2 (p=0,029, OR 2,65, IC95% 1,07–6,55); KCm >1 (p=0,025, OR 2,71, CI95% 1,10–6,69); GRACE MIH >180 (p=0,001, OR 4,09, CI95% 1,64–10,22); GRACE M6M >150 (p=0,001, OR 4,50, CI95% 1,80–6,27); GlicAd >140mg/dL (p=0,001, OR 5,74, CI95% 1,87–17,58); MaxTrop >42ng/mL (p=0,032, OR 2,64, CI95% 1,06–6,59). Regressão Logística obteve um modelo com os preditores GRACE M6M >150 (OR 3,26, p=0,014) e GlicAd >7,7mmol/L (OR 4,09, p=0,017) que se ajustou bem aos dados (Hosmer-Lemeshow: p=0,969).
Discussão/conclusõesEm doentes com EAM, varáveis habitualmente úteis na predição do risco de MIH, como GlicAd e função renal, insuficiência cardíaca aguda e o score de GRACE mostraram valor como preditores de AVC/AIT durante um follow-up de 2 anos. Enquanto um valor do Score de GRACE M6M >150 e GlicAd >7,7mmol/L se assumiram como preditores independentes de AVC/AIT, os factores de risco CV, a presença de CAD prévia e a extensão da coronariopatia não acrescentaram valor preditivo. Este estudo reforça a necessidade de uma prevenção secundária ainda mais agressiva em doentes com GRACE e GlicAD na admissão mais altos e com maior grau de disfunção renal.
Cardiovascular (CV) and cerebrovascular (CBV) diseases are closely linked despite the particular characteristics of each entity. Certain CV disorders predispose to stroke or transient ischemic attack (TIA), such as atrial fibrillation (AF), which is responsible for around 20% of ischemic strokes1. However, other comorbidities independently increase the risk for CBV events, as well as adding predictive value for the occurrence of stroke to that conferred by the presence of AF alone 2.
Patients admitted to cardiac care units for acute coronary syndrome are generally stratified according to risk of in-hospital and medium- and long-term mortality. The GRACE score is one tool used to predict mortality risk in patients with acute myocardial infarction (MI), but its value as a predictor of stroke or TIA has yet to be thoroughly studied, the same applying to other clinical and laboratory variables, such as peak troponin I and Killip class. Determining risk for cerebrovascular events in these patients could result in institution of more aggressive therapeutic measures or goals in higher-risk patient groups.
The aim of this study was to analyze the prognostic accuracy of the clinical and laboratory variables known to be useful in assessing in-hospital CV risk as potential predictors of CBV events during two-year follow-up of MI patients without previous stroke discharged in sinus rhythm.
MethodsWe retrospectively analyzed 404 consecutive patients admitted to our cardiac care unit with a diagnosis of MI during a 16-month period (December 2006-March 2008) who were subsequently discharged. Patients with previous stroke or who presented AF at any time during hospitalization or at discharge were excluded. Mean age was 68.1±13.7 years and 63.4 % were male. The admission diagnosis was ST-elevation myocardial infarction (STEMI) in 43.1 % of cases, non-ST elevation MI (NSTEMI) in 54 %, and undetermined MI in the remainder. With regard to previous history, 37 % had type 2 diabetes and 74 % hypertension (medicated with antihypertensives or not taking medication although prescribed by their general practitioner); dyslipidemia was present in 57.4 % (most with pure hypercholesterolemia) and 28.2 % were current smokers or had ceased within the previous 12 months. Only 5 % of patients had none of the traditional CV risk factors, while 32.7 % had at least three.
Nearly 30% of the study population had previously known coronary artery disease (CAD), and at least one significant stenotic lesion was documented by catheterization in 74.8 % (302 out of a total of 335 patients who underwent catheterization during hospital stay).
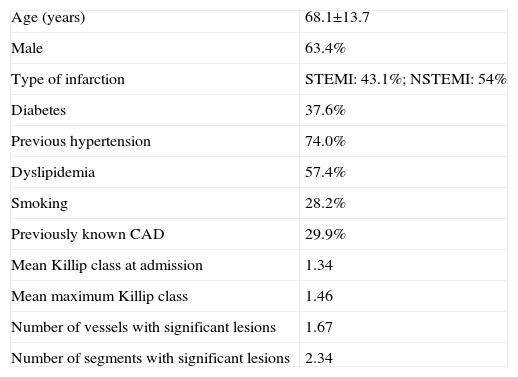
A detailed analysis was carried out of each patient's data (Table 1), including demographic characteristics, results of coronary angiography (when performed) and angioplasty procedures, laboratory results on admission (blood glucose [BG], creatinine, hemoglobin, lipid profile and C-reactive protein [CRP]), peak troponin I, physical examination on admission (blood pressure and heart rate, pulmonary auscultation, and assessment of signs of heart failure in the setting of MI according to Killip class) and pre-discharge echocardiogram to determine ventricular and left atrial dimensions in M-mode parasternal long-axis view and qualitative assessment of left ventricular (LV) function. The following were calculated: glomerular filtration rate (GFR) using the MDRD (GFR [ml/min/1.73m2]=186 × [serum creatinine]-1.154 × [age]-0.203 × [0.742 if female] × [1.210 if Afro-American]) and the Cockcroft-Gault (GFR=[(140-age) × (weight) × (0.85 if female)] / [72 × serum creatinine]) formulas, GRACE score using the electronic risk calculator3, and TIMI score in all patients with NSTEMI.
Population characteristics
| Age (years) | 68.1±13.7 |
| Male | 63.4% |
| Type of infarction | STEMI: 43.1%; NSTEMI: 54% |
| Diabetes | 37.6% |
| Previous hypertension | 74.0% |
| Dyslipidemia | 57.4% |
| Smoking | 28.2% |
| Previously known CAD | 29.9% |
| Mean Killip class at admission | 1.34 |
| Mean maximum Killip class | 1.46 |
| Number of vessels with significant lesions | 1.67 |
| Number of segments with significant lesions | 2.34 |
CAD: coronary artery disease; NSTEMI: non-ST elevation myocardial infarction; STEMI: ST-elevation myocardial infarction.
Patients were followed for 24 months to monitor occurrence of the primary endpoint (CBV event [TIA or stroke], the latter confirmed by brain CT). Information was obtained from the patients' medical records (consultations, hospitalizations and visits to the emergency department) and by telephone follow-up approximately every three months.
The patients were divided into two groups: group A: without CBV events during follow-up; and group B: with TIA or stroke during follow-up (n=27). The groups were compared to determine potential predictors of post-infarction CBV events.
Statistical analysisThe statistical analysis was carried out using SPSS version 16.0. Nominal variables were compared with the chi-square test, and continuous variables by the Student's t test, with equivalent non-parametric tests when appropriate. Univariate analysis using the chi-square test was performed to establish the correlation between occurrence of TIA or stroke and various potential predictive factors, calculating relative risk and 95 % confidence intervals. Multivariate logistic regression analysis was also performed to establish a predictive model of risk for CBV events. Results with p <0.05 were considered significant.
ResultsDuring the 24-month follow-up, there were 80 deaths, corresponding to 19.8 % of the study population; 113 (28%) had recurrent angina, 58 (14.4%) were hospitalized for reinfarction and the same number underwent repeat catheterization; 77 patients (17.5 % of the total) were admitted to an emergency department for decompensated heart failure (HF).
Twenty-seven patients (6.7 %) were admitted via the emergency department or hospitalized for an acute cerebrovascular event: stroke in 17 cases (confirmed by brain CT) and TIA in 10.
The mean age of patients with the primary endpoint (group B) was 75.76±7.82 years (of whom 14 were aged over 75, corresponding to an incidence of 8.1% in this age-group), and a third (n=9) were women (with a similar mean age to men: 76.6 vs 75.4 years, p=NS). Thirteen patients (48%) had diabetes, 21 (81.5%) had a history of hypertension, 15 had dyslipidemia (55.5 %), five were smokers or had recently quit (18.5%), and four had previously known CAD (14.8%). Thirteen patients had initially been admitted for STEMI (48.1 %), and of the 17 who underwent catheterization, 16 presented had least one significant stenotic lesion.
Group B were more likely to be rehospitalized for decompensated HF (43.8 % vs 16.0 %, p=0.05, OR 4.09, 95% CI 1.44-11.63) and had higher mortality during follow-up (47.1 % vs 17.4 %, p=0.03, OR 4.21, 95 % CI 1.54-11.55) (Table 2). However, on analysis of the patients who died during follow-up, survival time was not significantly shorter in those with CBV events (17.5 months vs 18.6, p=0.31).
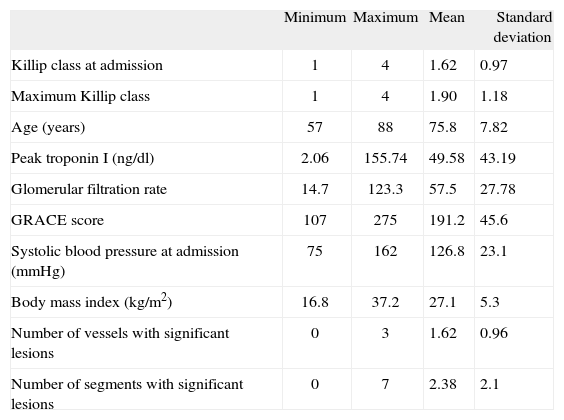
Characterization of the patient group with cerebrovascular events
| Minimum | Maximum | Mean | Standard deviation | |
| Killip class at admission | 1 | 4 | 1.62 | 0.97 |
| Maximum Killip class | 1 | 4 | 1.90 | 1.18 |
| Age (years) | 57 | 88 | 75.8 | 7.82 |
| Peak troponin I (ng/dl) | 2.06 | 155.74 | 49.58 | 43.19 |
| Glomerular filtration rate | 14.7 | 123.3 | 57.5 | 27.78 |
| GRACE score | 107 | 275 | 191.2 | 45.6 |
| Systolic blood pressure at admission (mmHg) | 75 | 162 | 126.8 | 23.1 |
| Body mass index (kg/m2) | 16.8 | 37.2 | 27.1 | 5.3 |
| Number of vessels with significant lesions | 0 | 3 | 1.62 | 0.96 |
| Number of segments with significant lesions | 0 | 7 | 2.38 | 2.1 |
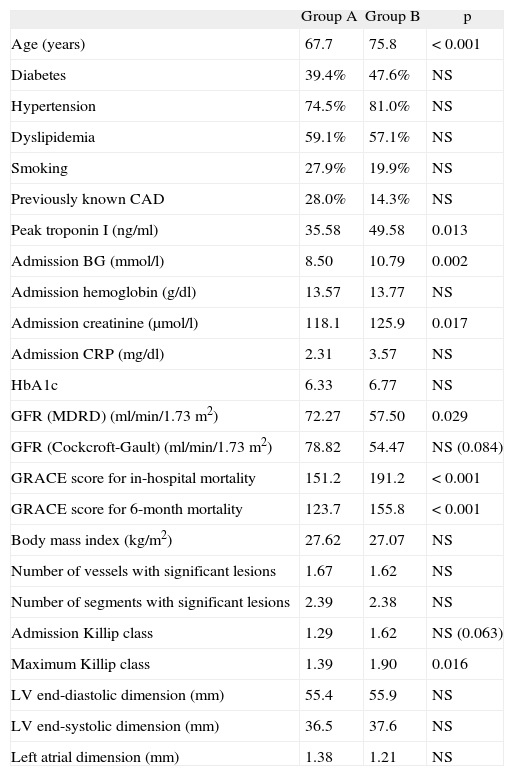
The mean age of group B patients tended to be older (75.8 vs 67.7 years, p=0.08, with those aged ≥75 having a slightly higher risk of stroke or TIA: 11.7 % vs 5.7 %, p=0.083, OR 2.17, 95 % CI 0.89-5.32), although they did not present a greater prevalence of traditional risk factors (diabetes, hypertension, dyslipidemia and smoking) or of previously known CAD. Catheterization during hospital stay did not show more severe CAD in these patients compared to the group without the primary endpoint. However, group B had higher GRACE scores for in-hospital and 6-month mortality (191.2 vs 151.2, p <0.001 and 155.8 vs 123.7, p <0.001, respectively), as well as higher maximum Killip class (1.90 vs 1.39, p=0.016). In fact, 57.1% of group B patients had a GRACE score for in-hospital mortality of >180 (vs 24.6 % of group A, p = 0.001, OR 4.09, 95 % CI 1.64-10.22) and 47.6 % showed signs of acute HF (defined as worsening Killip class during hospitalization or Killip class >1 in those without previously known HF) versus 25.1 % of group A (p=0.025, OR 2.71, 95% CI 1.1-6.69). Patients admitted for decompensated HF during follow-up also had a higher risk of stroke or TIA (15.2 % vs 4.2 %, p=0.05, OR 4.11, 95 % CI 1.44-11.69).
Analysis of laboratory parameters showed more extensive myocardial necrosis in group B (peak troponin I 49.58ng/ml vs 35.58ng/ml, p=0.013). This group also had higher admission BG (10.79mmol/l vs 8.50mmol/l, p=0.02) and more severe renal dysfunction, as reflected in higher admission creatinine (125.87μmol/l vs 118.09μmol/l, p=0.017) and lower GFR, whether calculated by the MDRD or the Cockcroft-Gault formula (57.4ml/min/1.73m2 vs 72.3ml/min/1.73m2, p=0.029; and 54.5ml/min/1.73m2 vs 78.8ml/min/1.73m2, p=0.049, respectively).
No statistically significant differences were observed between the two groups in terms of body mass index, pre-discharge echocardiographic data (left ventricular and left atrial dimensions and qualitative assessment of global systolic function) or the other laboratory parameters assessed, namely admission hemoglobin, glycosylated hemoglobin (HbA1c) and CRP.
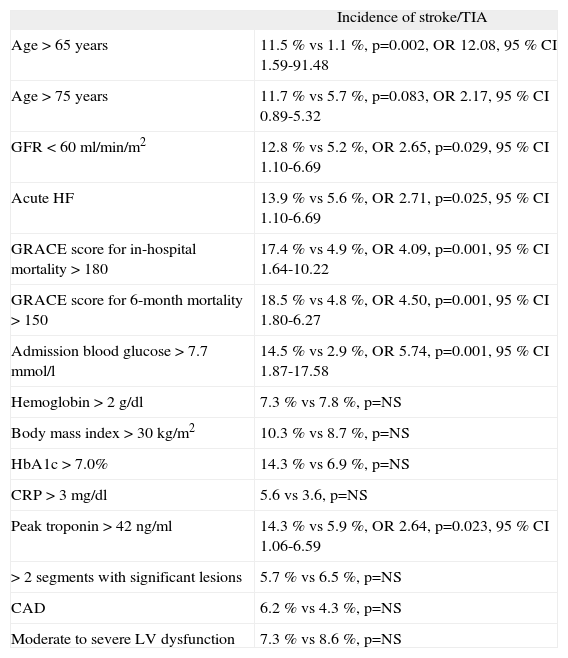
Univariate analysis was performed to assess the usefulness of a series of variables to predict CBV event risk during two-year follow-up (Table 3).
Comparison between groups
| Group A | Group B | p | |
| Age (years) | 67.7 | 75.8 | <0.001 |
| Diabetes | 39.4% | 47.6% | NS |
| Hypertension | 74.5% | 81.0% | NS |
| Dyslipidemia | 59.1% | 57.1% | NS |
| Smoking | 27.9% | 19.9% | NS |
| Previously known CAD | 28.0% | 14.3% | NS |
| Peak troponin I (ng/ml) | 35.58 | 49.58 | 0.013 |
| Admission BG (mmol/l) | 8.50 | 10.79 | 0.002 |
| Admission hemoglobin (g/dl) | 13.57 | 13.77 | NS |
| Admission creatinine (μmol/l) | 118.1 | 125.9 | 0.017 |
| Admission CRP (mg/dl) | 2.31 | 3.57 | NS |
| HbA1c | 6.33 | 6.77 | NS |
| GFR (MDRD) (ml/min/1.73m2) | 72.27 | 57.50 | 0.029 |
| GFR (Cockcroft-Gault) (ml/min/1.73m2) | 78.82 | 54.47 | NS (0.084) |
| GRACE score for in-hospital mortality | 151.2 | 191.2 | <0.001 |
| GRACE score for 6-month mortality | 123.7 | 155.8 | <0.001 |
| Body mass index (kg/m2) | 27.62 | 27.07 | NS |
| Number of vessels with significant lesions | 1.67 | 1.62 | NS |
| Number of segments with significant lesions | 2.39 | 2.38 | NS |
| Admission Killip class | 1.29 | 1.62 | NS (0.063) |
| Maximum Killip class | 1.39 | 1.90 | 0.016 |
| LV end-diastolic dimension (mm) | 55.4 | 55.9 | NS |
| LV end-systolic dimension (mm) | 36.5 | 37.6 | NS |
| Left atrial dimension (mm) | 1.38 | 1.21 | NS |
BG: blood glucose; CAD: coronary artery disease; CRP: C-reactive protein; GFR: glomerular filtration rate; HbAlc: glycosylated hemoglobin; LV: left ventricular. (Measurements in M-mode parasternal long-axis view)
Age >65 years was a predictor of stroke or TIA (11.5% vs 1.1 %, p=0.002, OR 12.08, 95 % CI 1.59-91.48), but age >75 was not statistically significant (11.7 % vs 5.7 %, p=0.083, OR 2.17, 95 % CI 0.89-5.32) (Table 4).
Predictors of cerebrovascular events on univariate analysis
| Incidence of stroke/TIA | |
| Age >65 years | 11.5 % vs 1.1 %, p=0.002, OR 12.08, 95 % CI 1.59-91.48 |
| Age >75 years | 11.7 % vs 5.7 %, p=0.083, OR 2.17, 95 % CI 0.89-5.32 |
| GFR <60ml/min/m2 | 12.8 % vs 5.2 %, OR 2.65, p=0.029, 95 % CI 1.10-6.69 |
| Acute HF | 13.9 % vs 5.6 %, OR 2.71, p=0.025, 95 % CI 1.10-6.69 |
| GRACE score for in-hospital mortality >180 | 17.4 % vs 4.9 %, OR 4.09, p=0.001, 95 % CI 1.64-10.22 |
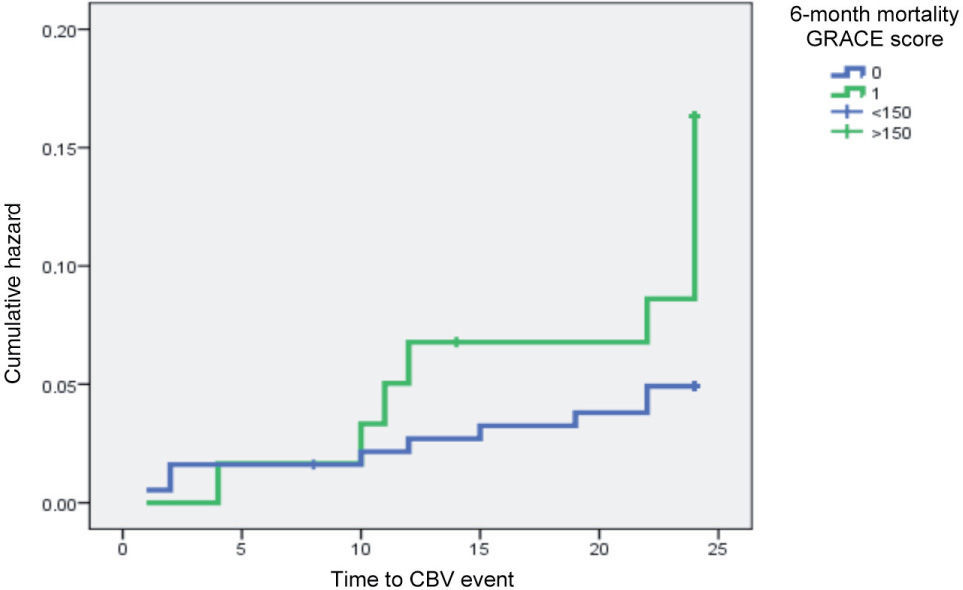
| GRACE score for 6-month mortality >150 | 18.5 % vs 4.8 %, OR 4.50, p=0.001, 95 % CI 1.80-6.27 |
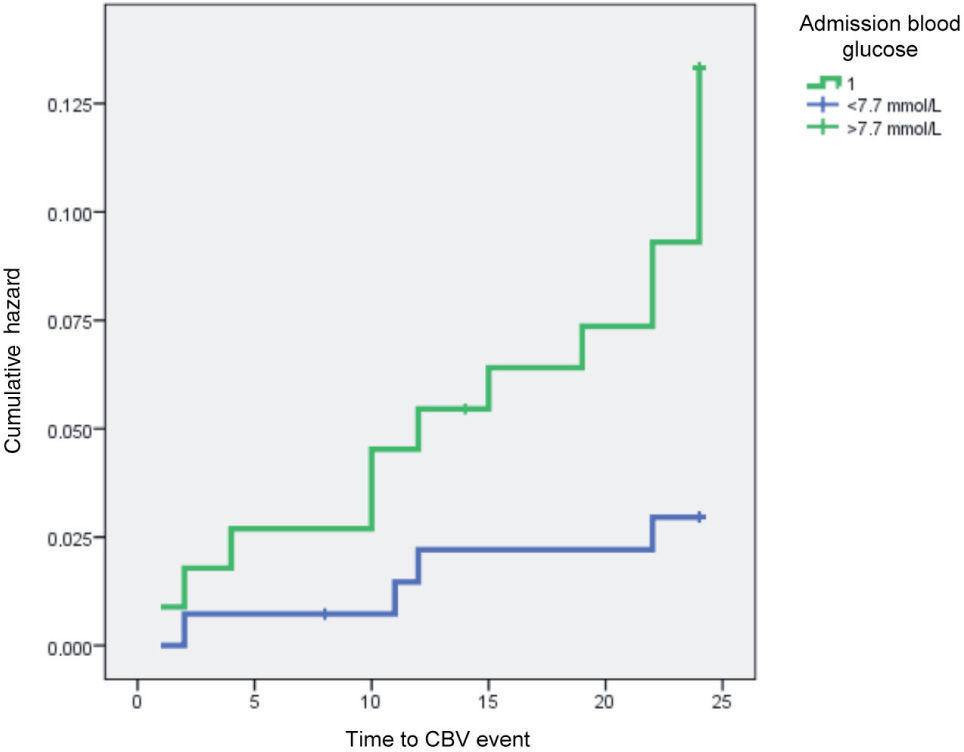
| Admission blood glucose >7.7mmol/l | 14.5 % vs 2.9 %, OR 5.74, p=0.001, 95 % CI 1.87-17.58 |
| Hemoglobin >2g/dl | 7.3 % vs 7.8 %, p=NS |
| Body mass index >30kg/m2 | 10.3 % vs 8.7 %, p=NS |
| HbA1c >7.0% | 14.3 % vs 6.9 %, p=NS |
| CRP >3mg/dl | 5.6 vs 3.6, p=NS |
| Peak troponin >42ng/ml | 14.3 % vs 5.9 %, OR 2.64, p=0.023, 95 % CI 1.06-6.59 |
| >2 segments with significant lesions | 5.7 % vs 6.5 %, p=NS |
| CAD | 6.2 % vs 4.3 %, p=NS |
| Moderate to severe LV dysfunction | 7.3 % vs 8.6 %, p=NS |
Acute HF: acute heart failure (defined as Killip class >1 at admission in the absence of previous HF and/or worsening Killip class during hospitalization; CAD: coronary artery disease (defined as at least one segment with >50% stenosis or >30% stenosis of the left main artery); CRP: C-reactive protein; GFR: glomerular filtration rate; HbAlc: glycosylated hemoglobin; LV: left ventricular.
Multivariate logistic regression analysis of potential predictors (including age >75 years, GFR <60ml/min/m2, acute HF, GRACE score for in-hospital mortality >180, GRACE score for 6-month mortality >150, stress hyperglycemia [admission BG >7.7mmol/l, equivalent to 140mg/dl] and peak troponin I >42ng/ml) resulted in a predictive model for CBV event risk that fitted the data well (Hosmer-Lemeshow: p=0.916) and included the following predictors:
- —
GRACE score for 6-month mortality >150 (p=0.016, OR 3.26, 95% CI 1.25-8.48);
- —
Stress hyperglycemia >7.7mmol/l (p=0.017, OR 4.09, 95% CI 1.28-13.02).
The other factors assessed were not included in the model.
The impact of GRACE score for six-month mortality and admission BG on CBV event risk is clearly shown by Kaplan-Meyer curve analysis (Figures 1 and 2).


Including age >65 (as opposed to >75) in the analysis, the resulting model, which also fitted the data well (Hosmer-Lemeshow: p=0.829), included admission BG >7.7mmol/l (p=0.06, OR 4.86, 95 % CI 1.56-15.12) and age >65 (p=0.022, OR 10.74, 95 % CI 1.40-82.36) as predictors, while GRACE scores were no longer included.
DiscussionThe incidence of cerebrovascular events after myocardial infarction, together with their predictors and impact on mortality, were assessed by Tanne et al., who concluded that there was a 1 % risk of stroke or TIA within a year of MI, with 31 % occurring within a month. Chronic AF, advanced age, anterior infarction, levels of aspartate aminotransferase four times higher than the upper normal limit and a previous history of MI or stroke identified high-risk individuals. The occurrence of stroke or TIA increased the age-adjusted 12-month mortality risk (31 % vs 9 %)4.
Loh et al. studied the effect of LV dysfunction after MI on stroke risk in 2231 patients followed for 42 months, and found an incidence of 4.6%; the authors concluded that advanced age, absence of antiplatelet therapy or anticoagulation and low LV ejection fraction were independent predictors of risk for CBV events, reporting an 18 % increase in stroke risk for every 5% decrease in ejection fraction5.
The VALIANT trial6, a prospective study of 14 703 survivors of MI complicated by HF and/or LV dysfunction aimed, among other objectives, at establishing predictive risk models of early (<45 days) or late stroke, reported that 463 patients (3.1 %) had this endpoint, of which 134 occurred within 45 days. GFR and heart rate (in sinus rhythm) were the strongest predictors of early stroke, while diastolic blood pressure >90mmHg, previous stroke and AF were the most important overall predictors. Gender did not affect stroke risk and, unlike in the study by Loh et al.5, ejection fraction did not help in predicting CBV event risk.
A meta-analysis by Witt et al. assessing stroke incidence after MI reported 11.1 ischemic strokes per 1000 patients during hospitalization for the index MI, 12.2 at 30 days and 21.4 at 12 months, with a mean of around 14.5. Predictors were advanced age, diabetes, hypertension, previous stroke or MI, anterior index MI, AF, HF and non-white ethnicity7.
In our population, the incidence of CBV events was 6.7% (27/404) at 24 months, of which 63 % (n=17) were stroke (confirmed by imaging studies), which corresponds to 4.2 % of the sample; this is similar to the percentages reported in many previous studies. The mean age of patients with CBV events was around 76 years, with an incidence of stroke and/or TIA of 8.1 % at two years in those aged >75, more than half the cases (14/27) in our study population, which supports recent evidence as reported by Lichtman et al.8.
A third of patients with the primary endpoint were female and of similar mean age to male patients. Petrea et al. reported gender differences in stroke incidence, highlighting the more advanced age of female patients and the higher incidence of stroke in women aged over 85 compared to men, with a lower incidence before this age9. The significant gender difference in occurrence of the primary endpoint in our population (two-thirds male) may be due to a higher prevalence of men in our sample (63.4%), while the small number of female patients (n=9) may explain the lack of a significant difference in the mean age of patients with stroke/TIA.
Patients with CBV events during follow-up did not present a higher prevalence of previously known CAD or more extensive CAD on catheterization at the time of the index MI, which may be due to a similar prevalence of traditional risk factors (diabetes, hypertension, dyslipidemia and smoking) and the multifactorial etiology of CBV disease. However, group B patients had more extensive myocardial necrosis on the index MI, as assessed by peak troponin I levels. This is in agreement with the findings of Thompson et al., who reported that stroke incidence in MI patients with CK of >1160IU/1 was 24 times higher than in those with lower levels, adding that higher CK valúes are associated with an even greater risk of CBV events10. However, the possible relationship between peak troponin I valúes and stroke/TIA risk has not previously been demonstrated.
Previous studies of MI patients have shown that CAD severity does not correlate with the extent of myocardial necrosis. More extensive collateralization in patients with multivessel disease explains lower post-infarction troponin I levels. However, infarction involving the left anterior descending artery usually affects a larger area of the myocardium, resulting in higher peak troponin I. Mooe et al. reported a trend (at the limit of statistical significance) for higher risk of CBV events following anterior MI, particularly STEMI11. The present study supports the first observation, with a higher incidence of the primary endpoint in patients with more extensive myocardial necrosis (usually associated with anterior infarction and a greater risk of acute and/or chronic HF), but did not find higher risk in patients with STEMI compared to those with NSTEMI. Complete and rapid access to catheterization in our center helps to limit infarct size in STEMI patients, thus reducing the extent of myocardial necrosis and rises in troponin I, which may explain this apparent contradiction.
The absence of an association in our population between CAD severity and risk for CBV events may be due to the short follow-up and the more aggressive and longer-term anti-platelet and lipid-lowering therapy (particularly with the more potent statins) used in patients with more extensive CAD, which help to stabilize atherosclerotic plaques in the carotid territory; the possibility of stroke of cardioembolic etiology in these patients, which is less strongly associated with the severity of atherosclerotic lesions, may also be a factor.
The GRACE score is a widely used tool in patients with acute coronary syndrome to predict risk of in-hospital and six-month MI or mortality. It also helps to predict risk of major CV events in patients with chest pain admitted to the emergency department, for which it is more effective than the TIMI score or electrocardiographic and laboratory data12. In our population, group B patients presented significantly higher GRACE scores for in-hospital and 6-month mortality, scores of >180 and >150, respectively, being associated with a four-fold higher risk of a CBV event within two years of the index MI. Although there have been no studies specifically assessing the value of this score in predicting CBV risk, this finding is not surprising given that the score includes variables that are associated with stroke/TIA risk, such as age, renal function and Killip class at admission.
The association between HF and CBV disease has been studied before. Appelros et al. reported a clear association between HF and severe stroke, also observing that early stroke mortality (within 30 days) was higher in patients with HF and/or LV dysfunction 13. Witt et al. compared a population with HF and a control population, concluding that stroke risk in HF patients was 17.4 times higher than in controls in the 30 days following diagnosis of HF and remained high for the following five years14.
In our population, patients with Killip class >1 at admission (in the absence of previous HF) or worsening Killip class during hospitalization presented a 2.7 times higher risk of CBV events during follow-up. Furthermore, irrespective of Killip class during hospitalization for the index MI, rehospitalization for decompensated HF resulted in a four-fold increase in risk of stroke/TIA. These results reflect the greater thromboembolic risk and the pro-inflammatory and pro-thrombotic state associated with HF.
Despite the clear association between HF and CBV event risk, LV dysfunction on pre-discharge echocardiography was not a predictor of stroke during follow-up, as seen in the VALIANT trial6. There are various reasons that may explain this finding:
- —
It is possible that patients with more severe LV dysfunction are treated more aggressively (higher-dose statins and ACE inhibitors or angiotensin receptor blockers), thus reducing the risk of ischemic stroke, which would otherwise tend to be higher than in those with no or mild LV dysfunction;
- —
A percentage of patients with severe LV dysfunction (very low ejection fraction, even in sinus rhythm) received oral anticoagulation even in the absence of thrombus or LV aneurysm. Some of these patients may have been medicated with warfarin during follow-up, reducing the incidence of cerebral thromboembolism;
- —
LV dysfunction and dilatation are associated mainly with embolic stroke, and are thus not directly related to cerebrovascular or carotid atherosclerosis.
Prediction of risk for cerebrovascular events after MI is improved by including laboratory variables, particularly blood glucose and renal function at admission for the index MI. A study by Hyvärinen et al. concluded that hyperglycemia two hours after a 75-g glucose load, even in non-diabetic patients, was a good predictor of risk for stroke mortality, particularly in men15.
In our study population, admission BG >7.7mmol/l (140mg/dl) increased the risk for stroke/TIA during follow-up almost six-fold, irrespective of HbA1c levels (which were similar in both groups, unlike in the Hong Kong Diabetes Registry, which reported an almost linear correlation between HbA1c and stroke risk16). In patients admitted for MI, hyperglycemia at admission is a risk factor for in-hospital and six-month mortality, and is also associated with higher risk for acute HF and rehospitalization for decompensated HF. An as yet unanswered question is whether hyperglycemia at admission is merely a risk marker or whether in itself it increases CV risk. Aggressive as opposed to standard treatment of elevated admission BG is not currently recommended. Stress hyperglycemia at admission may reflect greater systemic stress, due to more extensive infarction, acute HF and concomitant renal dysfunction, resulting in higher in-hospital and late mortality and greater risk for CV or CBV events after the index MI. The possible relationship between stress hyperglycemia and increased CBV risk has not previously been convincingly established.
The same comment could be made on the role of renal dysfunction as a risk marker. GFR as calculated by the MDRD formula (but not the Cockcroft-Gault formula) identified patients in whom the index MI had greater hemodynamic repercussions. Acute or worsening chronic renal failure predicted higher risk for acute HF and cardiovascular events during two-year follow-up, and is thus a strong risk predictor. The fact that advanced atherosclerosis (particularly carotid disease) is usually associated with chronic renal failure, together with the pro-thrombotic and pro-inflammatory state found in the condition, and its association with variables with undisputed predictive power for stroke, makes GFR a useful tool to predict cerebrovascular event risk after MI. However, it should be noted that GFR, whether calculated by the MDRD (4 variables), modified MDRD (6 variables) or Cockcroft-Gault formulas, is not sufficiently reliable in acute patients, particularly in cases of high BUN-to-serum creatinine ratios, and tends to overestimate GFR 17. These results should therefore be interpreted with caution.
High-sensitivity CRP is continuously and independently associated with risk for CAD, ischemic stroke and vascular mortality, even after adjustment for gender, age and traditional CV risk factors18. However, in our sample, CRP did not predict CBV event risk during follow-up. This may be due to the fact that our hospital's laboratory did not use a high-sensitivity assay.
Multivariate analysis produced a model that included GRACE score for 6-month mortality >150 and BG >7.7mmol/l at the index admission as predictors. Age >75 years, renal failure grade >2, acute HF and peak troponin I >42ng/ml did not improve the model obtained with the above two variables, even though they were shown to be predictors of stroke/TIA on univariate analysis. This is not surprising given that the GRACE score parameters already include age, renal function and acute HF at admission. The data also show that the GRACE score for 6-month mortality has greater value in predicting CBV event risk than the score for in-hospital mortality, which is entirely logical. When age > 65 years was included as a factor, the predictive model no longer included the GRACE score but admission BG >7.7mmol/l remained. In our sample, age >65 years was a stronger predictor of stroke/TIA than the GRACE score, probably due to the low incidence of stroke in our study in those aged <65 (only one case). In our population, stroke or TIA began to occur after the age of 65, a sizable proportion in the 65-75 age-group.
Admission stress hyperglycemia (>7.7mmol/l) was included in both predictive models and was shown to be a powerful predictor of CBV events after MI, as well as of in-hospital and late mortality and of global CV risk, as previously demonstrated.
Study limitationsAn important limitation of the study is the fact that the incidence of AF was not systematically investigated during the 24 months of follow-up. AF is known to be responsible for around 20 % of ischemic strokes, and so our aim was to assess other variables as predictors of CBV events. AF incidence during follow-up and its possible correlation with the primary endpoint would be difficult to determine for the following reasons:
- –
A significant proportion of AF episodes are asymptomatic and/or of short duration, and as such go unnoticed;
- –
Establishing a correlation between the occurrence of AF and a CBV event in patients with advanced atherosclerosis (particularly of the carotid vascular bed) is difficult, if not impossible in some cases;
- –
Accurate detection of paroxysmal AF is only possible using a continuous cardiac monitoring device, which would have considerably increased the complexity of the study, affecting its feasibility. Routine screening for AF after MI is not recommended.
The CARISMA study found that the incidence of new-onset AF after MI in patients with ejection fraction of <40% was 25-32% in a two-year follow-up19. In that study, only 20% of the patients initially enrolled agreed to implantation of a Reveal device, which illustrates the problems in performing this type of study. Moreover, the patients included all had ejection fraction of <40 %, unlike our study population, which in theory suggests that AF incidence in our sample would have been lower than that reported in the CARISMA study. Nevertheless, this aspect should be considered the main limitation of the present study.
ConclusionsCerebrovascular events are a possible complication of MI. A small but clinically significant percentage of patients are admitted to the emergency department or hospitalized for stroke or TIA within two years of an acute coronary syndrome, and are at higher risk of mortality during that period. Age and clinical criteria such as occurrence of HF during the index admission and decompensated HF during follow-up, laboratory parameters including admission blood glucose and renal function, extent of myocardial necrosis, and GRACE scores all help to predict CBV event risk after MI. This enables cerebrovascular preventive measures to be strengthened, including more rigorous and aggressive control of traditional risk factors, use of higher-dose statins and possibly more potent and longer-term antiplatelet therapy, or even oral anticoagulation in high-risk patients, given the thromboembolic etiology usually found in patients with HF after MI. Age over 65 years, admission BG of >7.7mmol/l, and a GRACE score for 6-month mortality of >150 are important predictors and should alert the clinician to a higher risk for stroke or TIA following discharge after a cardiovascular event, even in the absence of severe CAD. To the best of our knowledge, the value of stress hyperglycemia, GRACE score for 6-month mortality and elevated troponin I levels in prediction of cerebrovascular event risk after MI has not previously been demonstrated.
Conflicts of interestThe authors have no conflicts of interest to declare.
