Clinical guidelines recommend the use of cardiovascular risk assessment tools (risk scores) to predict the risk of events such as cardiovascular death, since these scores can aid clinical decision-making and thereby reduce the social and economic costs of cardiovascular disease (CVD). However, despite their importance, risk scores present important weaknesses that can diminish their reliability in clinical contexts. This study presents a new framework, based on current risk assessment tools, that aims to minimize these limitations.
MethodsAppropriate application and combination of existing knowledge is the main focus of this work. Two different methodologies are applied: (i) a combination scheme that enables data to be extracted and processed from various sources of information, including current risk assessment tools and the contributions of the physician; and (ii) a personalization scheme based on the creation of patient groups with the purpose of identifying the most suitable risk assessment tool to assess the risk of a specific patient.
ResultsValidation was performed based on a real patient dataset of 460 patients at Santa Cruz Hospital, Lisbon, Portugal, diagnosed with non-ST-segment elevation acute coronary syndrome. Promising results were obtained with both approaches, which achieved sensitivity, specificity and geometric mean of 78.79%, 73.07% and 75.87%, and 75.69%, 69.79% and 72.71%, respectively.
ConclusionsThe proposed approaches present better performances than current CVD risk scores; however, additional datasets are required to back up these findings.
As recomendações clínicas prevêem o uso de ferramentas de avaliação de risco cardiovascular para determinar o risco de um evento, p. ex. morte cardiovascular, pois podem auxiliar a decisão clínica reduzindo assim os custos sociais e económicos da doença cardiovascular (DCV). No entanto, esta avaliação de risco apresenta algumas fragilidades que podem comprometer a sua aplicação em contexto clínico. Este trabalho, tendo por base ferramentas de avaliação de risco aplicadas na prática clínica, pretende minimizar as limitações identificadas.
MétodosA exploração/combinação de conhecimento existente é o principal foco deste trabalho, no qual são desenvolvidas duas metodologias: i) a criação de um esquema de combinação que permita a extração e processamento de dados de diversas fontes de informação: ferramentas de avaliação de risco aplicadas na prática clínica, literatura e/ou contribuições dos cardiologistas; ii) sistema de personalização baseado na criação de grupos de pacientes, com o objetivo de identificar a ferramenta de avaliação de risco mais adequada para um paciente específico.
ResultadosA validação foi efetuada com base num conjunto de dados reais: i) Hospital Santa Cruz, Portugal, 460 pacientes com síndrome coronária aguda sem elevação do segmento ST (SCAsEST). Nas duas abordagens foram obtidos resultados promissores, sendo registados respetivamente valores de sensibilidade, especificidade e média geométrica de (78,79%, 73,07% e 75,87%); (75,69%, 69,79% e 72,71).
ConclusõesAs metodologias propostas apresentaram melhores resultados quando comparadas com as ferramentas individuais de avaliação de risco aplicadas na prática clínica; no entanto são necessários conjuntos de dados adicionais para reforçar estas conclusões.
More people die annually from cardiovascular disease (CVD) than from any other cause, representing approximately 30% (17.3 million) of all deaths worldwide.According to World Health Organization (WHO) estimates, the number of people dying from CVD will increase to 23.3 million by 2030, remaining the single leading cause of death.1 Furthermore, in Europe, the number of elderly will increase, making this scenario even more severe as age is a key risk factor for CVD development.2
Evidence of the mounting social and economic costs of CVD is forcing a change in the current health care paradigm, obliging health systems to move from reactive towards preventive care. According to the European Heart Network around 80% of coronary heart disease (CHD) is preventable, indicating that improvements in preventive health care can produce important benefits and reduce the incidence of CVD.3 Research lines in information and communication technology (ICT) also reflect this approach; the ICT in disease prevention project (PREVE) states that the main goal should be “having the individual as a co-producer of health” and empowering individuals to take responsibility for their health with personalized ICT.4
This new approach involves transferring care from the hospital to the patient's home, where health telemonitoring systems can assume critical importance in improving healthcare, as in the HeartCycle project.5a These systems enable patients to be monitored remotely, using devices (interfaces and sensors) installed in the patient's house that can collect and process clinical data such as weight and ECG readings and send them to the care provider. Feedback, which may include the triggering of alarms, can be provided directly to the patient as well as to the care provider. Interfaces such as smartphones are used to obtain additional subjective information from the patient as well as to provide feedback to both patients and professionals, creating a patient loop and a professional loop.
In this context, in the hospital or in the patient's home, the assessment of the risk of an event due to CVD (which can be classified as a hard endpoint such as death or myocardial infarction or a soft endpoint such as hospitalization or disease development6) is a critical issue.
CVD risk assessment tools allow physicians to assess the probability of an individual suffering an event based on a set of risk factors.7,8 These tools can be characterized in different ways: long-term (years) applied to primary prevention9–12 or short-term (months) for secondary prevention13–16; type of events predicted (hard or soft endpoints); type of disease (coronary artery disease, heart failure, etc.); risk factors considered in the model, such as age and gender; and the patient's status (outpatient, inpatient, etc.).
Risk assessment tools can be valuable aids to physicians in devising the patient's personal care plan,17 but they have important weaknesses: (i) weak performance under certain conditions (e.g. different populations); (ii) inability to incorporate knowledge from current CVD risk assessment tools; (iii) the need to select a particular tool to be applied in daily practice; (iv) the inability to incorporate new risk factors; (v) difficulty in coping with missing risk factors; and (vi) possible inability to ensure the clinical interpretability of the model.
This study presents a new framework that aims to minimize these limitations. Two different methodologies are proposed: (i) a combination scheme that enables data to be extracted and processed from various sources of information, including current risk assessment tools and the contributions of the physician; and (ii) a personalization scheme based on the creation of patient groups with the purpose of identifying the most suitable tool to assess the risk of a specific patient.
These methodologies were validated based on a real patient dataset made available by Santa Cruz Hospital, Lisbon, Portugal, of 460 patients diagnosed with non-ST-segment elevation acute coronary syndrome (NSTE-ACS). This dataset enabled the validation process to focus on secondary prevention (coronary artery disease patients, short-term risk prediction, and the combined endpoint of death/myocardial infarction).
MethodsTwo different methodologies were developed: (i) combination scheme; (ii) personalization scheme based on groups of patients.
Combination schemeThis approach aims to combine CVD risk assessment tools and is based on two main hypotheses: (i) it is possible to create a common representation of individual CVD risk assessment tools; (ii) it is possible to combine the resulting individual models in a common framework.
Common representation of CVD risk assessment toolsThe common representation must be simple in order to allow the different individual models to be easily integrated, and it should have sufficient flexibility to incorporate additional variables. Moreover, its parameters and rules must be clinically interpretable.
The first step of this methodology is to represent the selected CVD risk assessment tools using a common machine learning classification algorithm (classifier), i.e. an algorithm that learns how to assign the correct output's class label to testing instances. These algorithms can be based on neural networks, decision trees, Bayesian classifiers, or nearest neighbors.18 The classifier must be selected considering not only that the individual modelsb have to be combined but also that they have to deal with missing risk factors and ensure the clinical interpretability of the model.
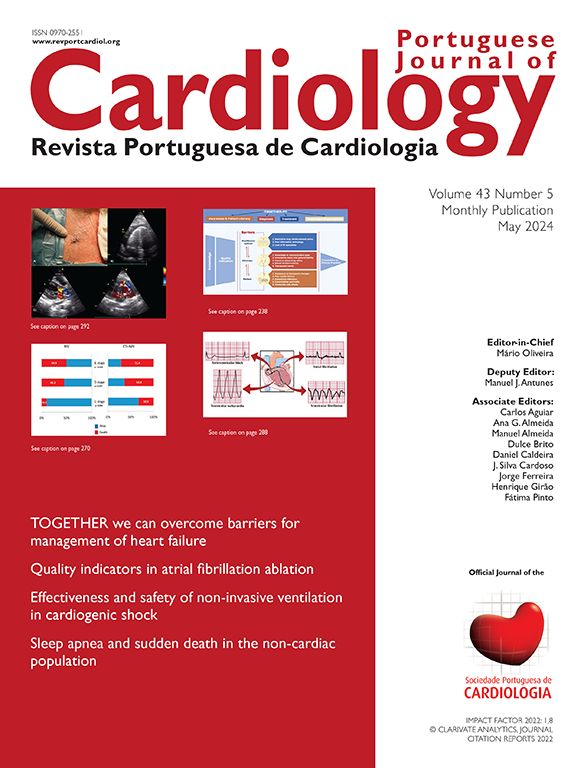
Naïve Bayes classifiers present some characteristics that are particularly suitable for CVD risk assessment.19 Such a classifier is probabilistic, implementing a particular structure of a Bayesian network (Figure 1). In this figure, X is an observation (e.g. a set of risk factors), Xi i=1,… p being the ith risk factor, and C a hypothesis (such as CVD risk level). It relies on the Bayes rule as presented in Equation (1):
where the term P(C|X) denotes a posterior probability, i.e. the probability of the hypothesis C after having seen the observation X. P(C) being the prior belief, the probability of the hypothesis before seeing any observation (prevalence of the CVD risk level). P(X|C) is a likelihood, the probability of the observation if the hypothesis is true (sensitivity of the clinical exam).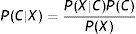

The goal is to represent the behavior of a CVD risk assessment tool, so the new model must learn the parameters P(X|C);P(C);P(X) that allow the determination of P(C|X).
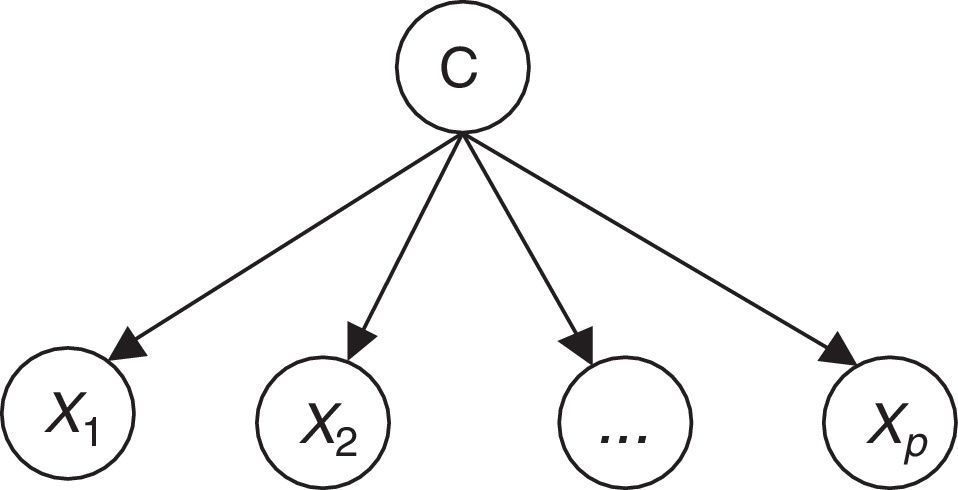
Therefore, the parameters of an individual model are learned based on a training dataset that is applied to the corresponding CVD risk assessment tool. A set of instances (patients) is applied to a risk assessment tool, e.g. GRACE, in order to obtain the respective outputs as represented in Figure 1. In this way, a labeled dataset (risk factors and respective output) J={(x1,c1),…,(xN,cN)} can be obtained. These data allow the definition of P(X|C);P(C);P(X) to build the Bayesian model (Figure 2).

The same procedure must be repeated for each CVD risk assessment tool in order to create the respective Bayesian model. The technical details of the learning process as well as of the naïve Bayes inference mechanism can be found in Paredes et al.20
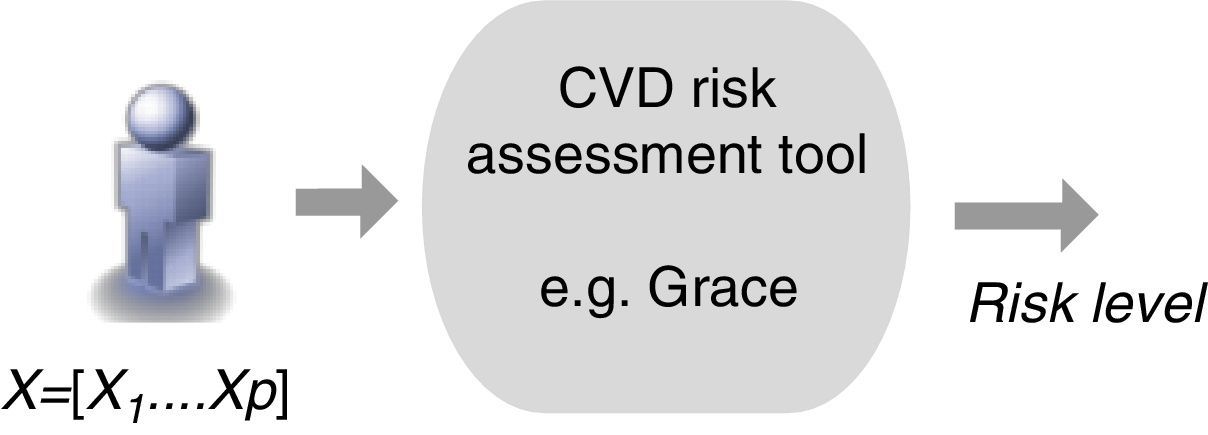
Combination of individual modelsThe combination of individual Bayesian models is the second step of the proposed methodology. According to various authors an ensemble of classifiers is often more accurate than any of the respective single classifiers.21 The methods for implementing model combination can be categorized according to the model output combination, which covers voting (e.g. simple voting, dynamic voting) and selection (e.g. information criteria) methods,21,22 and model parameter data fusion, in which a direct combination of the parameters of individual models is implemented.23 This is the approach proposed in the present work, in which a global model is created directly from the fusion of the individual models, exploiting the particular features of the Bayesian inference mechanism (Figure 3).

Each model i is characterized by the respective prior probability of output class P(Ci) and its conditional probability table composed of P(Xi|Ci), where Xi is the set of risk factors (inputs) considered by the model i.
The combination scheme implements the direct combination of the individual models’ parameters, where P(C);P(XG|C) are obtained based on the different P(Ci);P(Xi|C), through a weighted average combination scheme24 which: (i) assigns to each model a different weight that is proportional to the respective performance; (ii) allows a specific model to be disabled, so that different individual model selection criteria for inclusion in the combination scheme may be implemented; (iii) allows the incorporation of additional risk factors to improve risk prediction. A new model, based on the prevalence of a specific risk factor and on the risk associated with each of its categories, can be created directly by the physician and easily incorporated in the combination scheme. This is an important characteristic of this method.
Subsequently, an optimization procedure, based on a genetic algorithm, is applied to the parameters of the global model,24 with the goal of improving its predictive performance. However, the optimization procedure must not distort the knowledge provided by the original models, i.e. it must ensure the clinical significance of the global model. The adjustment must therefore be constrained to the neighborhood of the initial values, simultaneously maximizing the specificity and sensitivity of the global model (multi-objective optimization). For this purpose functions f1 and f2 (Equation (2)) have to be minimized.
TP: true positive; TN: true negative; FN: false negative; FP: false positive.Personalization based on groups of patients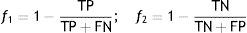
The personalization of CVD risk assessment with grouping of patients is based on the observation that risk assessment tools perform differently in different populations, which raises the hypothesis that if patients are properly grouped it is possible to find the best model (classifier) for each group. Two different approaches (clustering and similarity measures) were implemented.
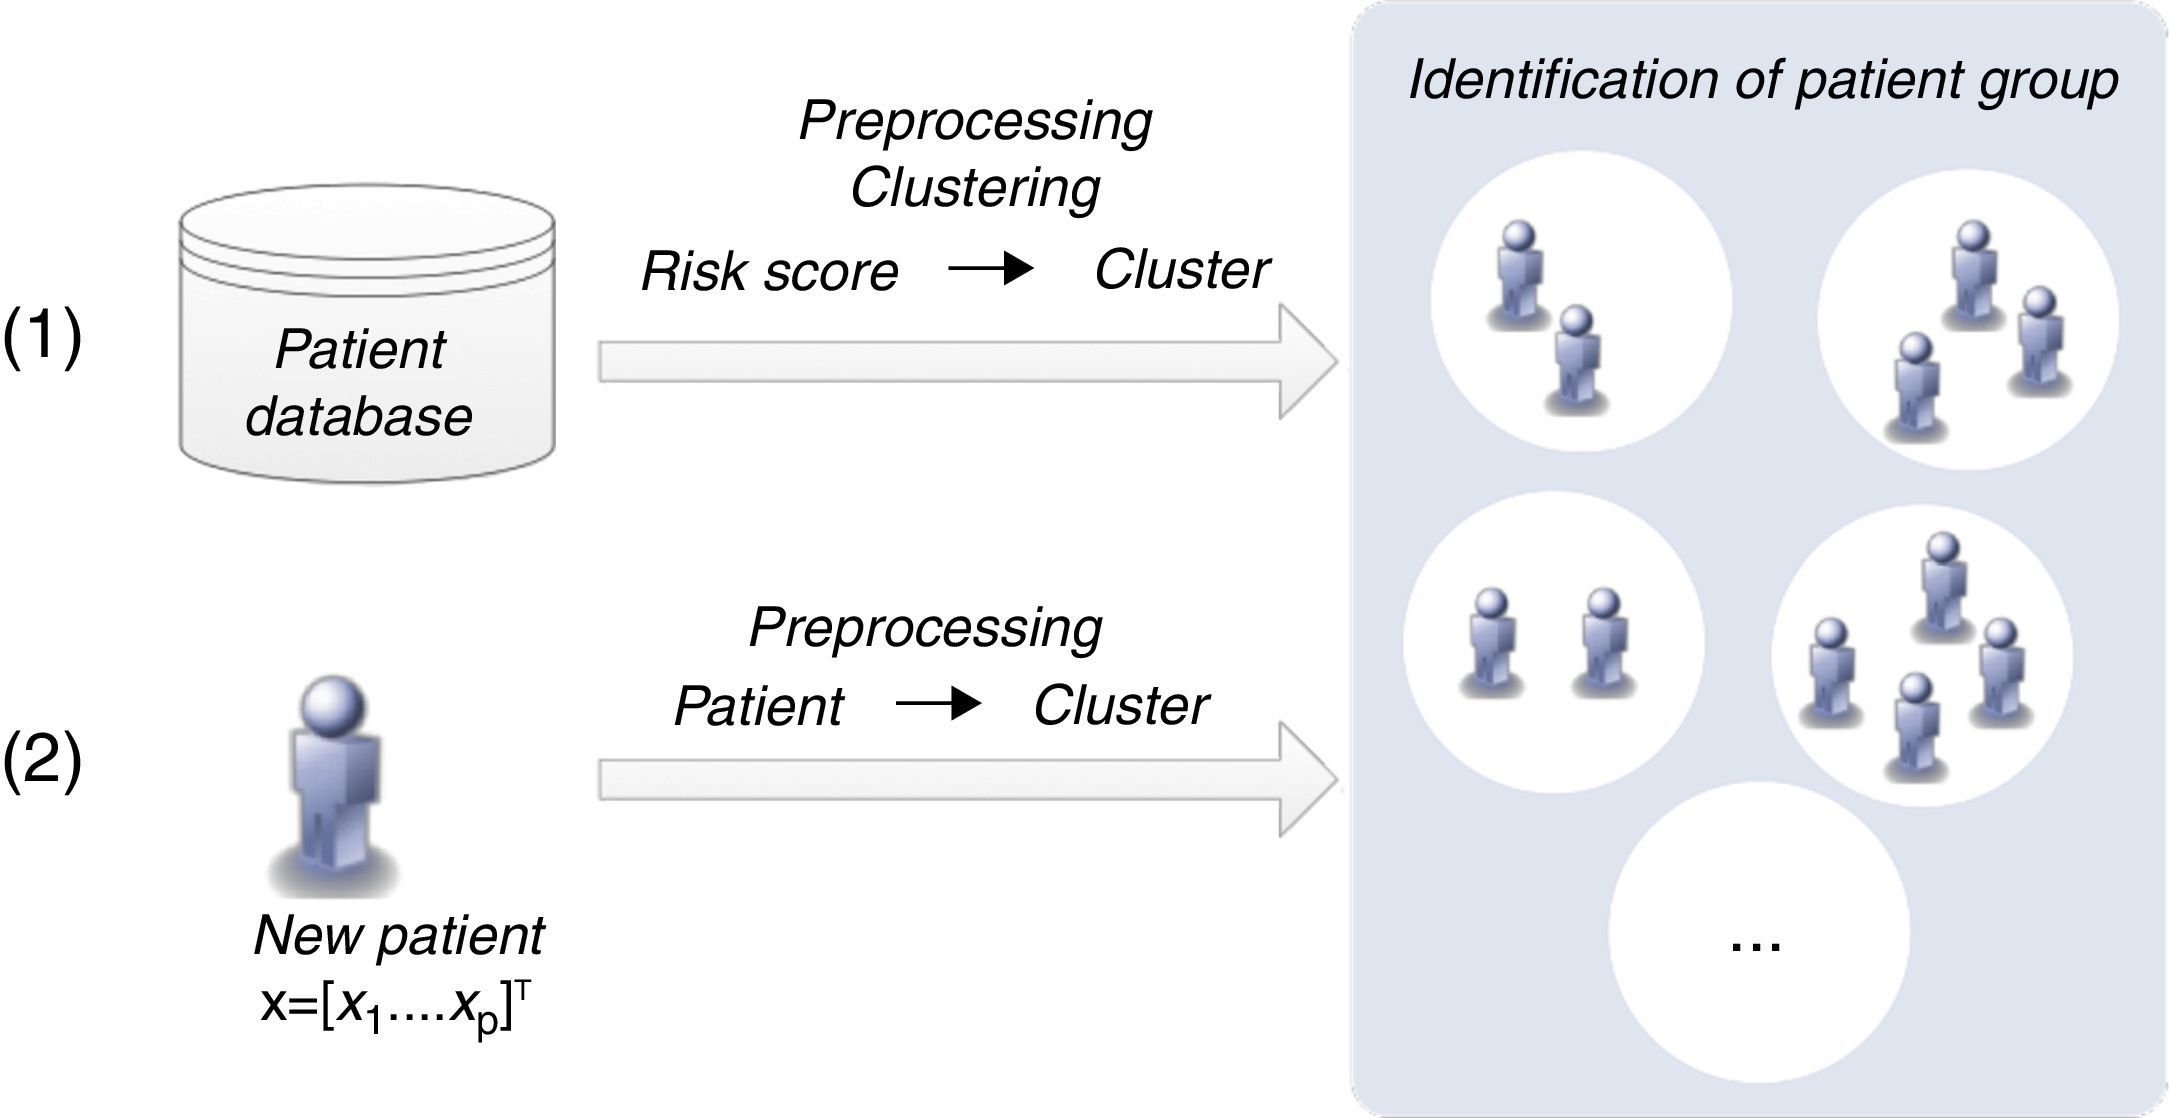
Patient clustering approachClustering algorithms are unsupervised learning algorithms, i.e. they try to find hidden structures in unlabeled data. Thus, the identification of groups of patients is based exclusively on the values of the risk factors (inputs) considered. Figure 4 presents the two main phases (training and classification) of the patient clustering approach.

The training process involves the creation of a set of clusters. The data are first preprocessed and then a subtractive clustering algorithm is applied in order to create groups of patients.25 Patients are grouped based on the values of respective risk factors, which requires the adoption of a distance metric to quantify the distance between patients.25
This subtractive clustering algorithm is a density-based algorithm that creates a varying number of clusters according to: (i) the distribution of patients, i.e. values of the risk factors, (ii) the dimension of the data space, i.e. the number of risk factors, and (iii) the specified radius to assess the density of the elements. After cluster creation, CVD risk assessment tools are assigned to the various clusters based on their respective performance, i.e. the tool with the best performance in a specific cluster is assigned to that cluster. The classification of a new patient can be simply described in two steps: (i) the patient is assigned to a specific cluster (the closest); (ii) the patient is classified by the CVD risk assessment tool with the best performance in that cluster.
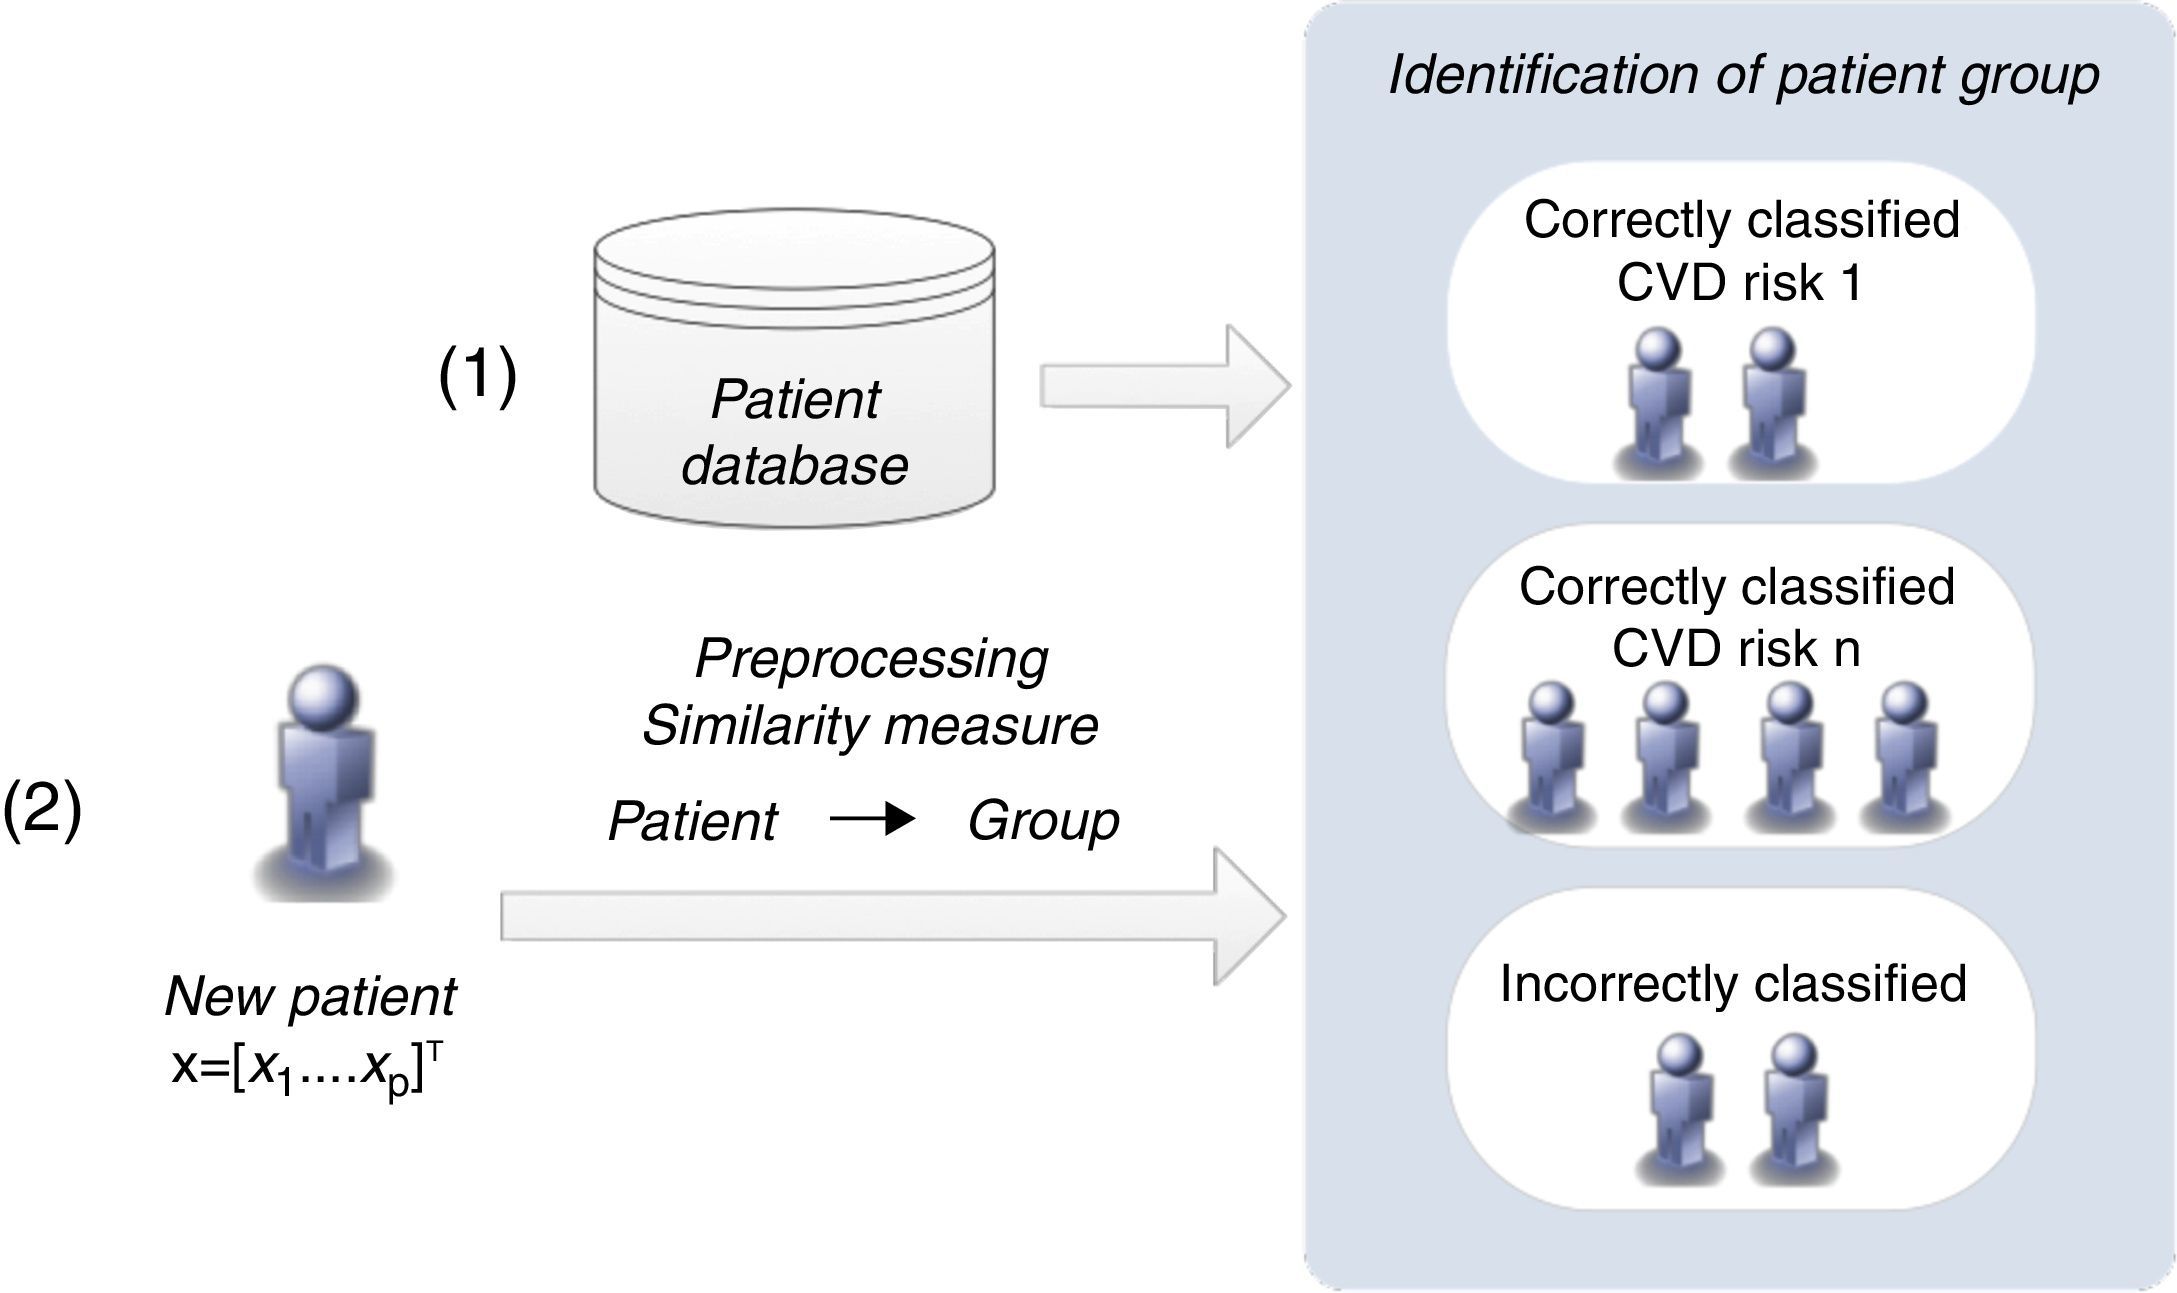
Similarity measures approachThis methodology proposes a simpler strategy to form groups of patients. The groups are created according to the patients’ classification with the CVD risk assessment tools (Figure 5).

The classification of a new patient is based on a similarity measure: if a new patient is closest to one that is correctly classified by a CVD risk assessment tool, it is probable that the same tool will also be able to classify the new patient accurately. In this way, the groups of patients are formed of those correctly classified by each CVD risk tool. This differs from the clustering algorithm, in which the classification of each CVD risk assessment tool is not considered in the creation of the groups.
If a patient is not correctly classified by any of the individual CVD risk assessment tools, he/she is assigned to a group that is classified by the CVD risk tool with the highest sensitivity when applied to the entire training dataset. Identification of the closest patient is not obvious, since it requires a comparison between several distance metrics (e.g. Euclidean or Hamming).25 Additionally, with the goal of improving the identification of the closest patient, a weighted strategy was implemented, in which a specific weight was assigned to each risk factor. An optimization procedure, based on genetic algorithms, was carried out to adjust these weights.26
ValidationA real patient testing dataset provided the real-world data required to compute the metrics applied in the performance assessment: sensitivity (SE), specificity (SP) and their geometric mean (Gmean) (Gmean=SE×SP). Additionally, the likelihood ratios (LR+=SE/(1−SP);LR−=(1−SE)/SP) were also calculated, as they provide information on the real value of performing a binary classification (low-risk/high-risk patients) based on the proposed methodologies.
The binary classification was validated by the clinical partner of this work, which stated that the reduction of output categories to low risk and high risk is correct. In fact, the aim of the cardiologist in clinical practice is frequently to discriminate between high-risk and low-risk patients. Thus, from a clinical perspective, identification of intermediate-risk patients may be less significant. This is particularly true in this work as the validation procedure only considers secondary prevention. However, it is important to emphasize that the methodologies developed can also be applied to a multiclass classification in which the number of output risk classes is greater than two. Multiclass classification problems can be decomposed into multiple binary classification procedures whose outputs are combined to generate the final classification.27
The metrics were obtained by comparing the model outputs (low risk/high risk) with the real data (no event/event). Accuracy was not calculated, as the available testing dataset was severely unbalanced.
The proposed strategies were validated based on a 10-fold cross-validation and 30 runs. Non-parametric statistical tests (Friedman's ANOVA complemented with the Bonferroni correction) were also applied, in order to reinforce the conclusions of the validation.
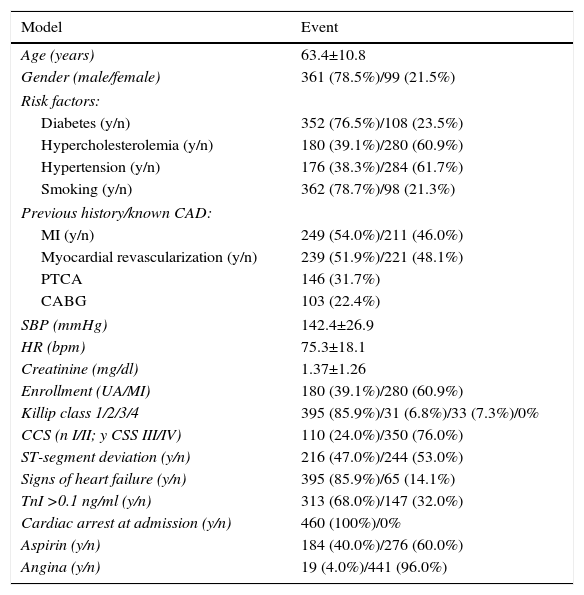
ResultsDatasetThe validation results were obtained based on a real patient dataset made available by Santa Cruz hospital, Lisbon (Table 1). This dataset contains data from 460 consecutive patients admitted with NSTE-ACS between March 1999 and July 2001. The event rate of the combined endpoint (death/myocardial infarction) was 7.2% (33 events).
Santa Cruz hospital dataset.
| Model | Event |
|---|---|
| Age (years) | 63.4±10.8 |
| Gender (male/female) | 361 (78.5%)/99 (21.5%) |
| Risk factors: | |
| Diabetes (y/n) | 352 (76.5%)/108 (23.5%) |
| Hypercholesterolemia (y/n) | 180 (39.1%)/280 (60.9%) |
| Hypertension (y/n) | 176 (38.3%)/284 (61.7%) |
| Smoking (y/n) | 362 (78.7%)/98 (21.3%) |
| Previous history/known CAD: | |
| MI (y/n) | 249 (54.0%)/211 (46.0%) |
| Myocardial revascularization (y/n) | 239 (51.9%)/221 (48.1%) |
| PTCA | 146 (31.7%) |
| CABG | 103 (22.4%) |
| SBP (mmHg) | 142.4±26.9 |
| HR (bpm) | 75.3±18.1 |
| Creatinine (mg/dl) | 1.37±1.26 |
| Enrollment (UA/MI) | 180 (39.1%)/280 (60.9%) |
| Killip class 1/2/3/4 | 395 (85.9%)/31 (6.8%)/33 (7.3%)/0% |
| CCS (n I/II; y CSS III/IV) | 110 (24.0%)/350 (76.0%) |
| ST-segment deviation (y/n) | 216 (47.0%)/244 (53.0%) |
| Signs of heart failure (y/n) | 395 (85.9%)/65 (14.1%) |
| TnI >0.1 ng/ml (y/n) | 313 (68.0%)/147 (32.0%) |
| Cardiac arrest at admission (y/n) | 460 (100%)/0% |
| Aspirin (y/n) | 184 (40.0%)/276 (60.0%) |
| Angina (y/n) | 19 (4.0%)/441 (96.0%) |
CABG: coronary artery bypass grafting; CAD: coronary artery disease; CCS: Canadian Cardiovascular Society angina classification; MI: myocardial infarction; n: no; PTCA: percutaneous transluminal coronary angioplasty; SBP: systolic blood pressure; TnI: troponin I; UA: unstable angina; y: yes.
Another dataset, from the Leiria Pombal Hospital Center with 99 NSTE-ACS patients, was considered, but its low number of events (five) was insufficient for complete validation of the proposed approaches.
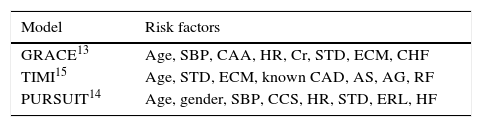
Cardiovascular risk assessment toolsThree of the best-known CVD risk assessment tools (GRACE, TIMI and PURSUIT) were selected to validate the proposed approaches (Table 2). The validation focused on secondary prevention (CAD patients), short-term risk (one month) and the combined endpoint of death/myocardial infarction.
Short-term risk assessment models.
| Model | Risk factors |
|---|---|
| GRACE13 | Age, SBP, CAA, HR, Cr, STD, ECM, CHF |
| TIMI15 | Age, STD, ECM, known CAD, AS, AG, RF |
| PURSUIT14 | Age, gender, SBP, CCS, HR, STD, ERL, HF |
AG: two or more angina events in the past 24 hours; AS: use of aspirin in the previous seven days; CAA: cardiac arrest at admission; CAD: coronary artery disease; CCS: Canadian Cardiovascular Society angina classification; CHF: congestive heart failure; Cr: creatinine; ECE: elevated cardiac enzymes; ERL: enrollment (myocardial infarction/unstable angina); HF: heart failure; HR: heart rate; RF: three or more cardiovascular risk factors; STD: ST-segment depression.
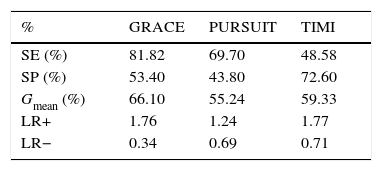
The Santa Cruz dataset was applied to these three CVD risk assessment tools, producing the results presented in Table 3.
Performance of cardiovascular risk assessment tools.
| % | GRACE | PURSUIT | TIMI |
|---|---|---|---|
| SE (%) | 81.82 | 69.70 | 48.58 |
| SP (%) | 53.40 | 43.80 | 72.60 |
| Gmean (%) | 66.10 | 55.24 | 59.33 |
| LR+ | 1.76 | 1.24 | 1.77 |
| LR− | 0.34 | 0.69 | 0.71 |
Gmean: geometric mean; LR+: positive likelihood ratio; LR−: negative likelihood ratio; SE: sensitivity; SP: specificity.
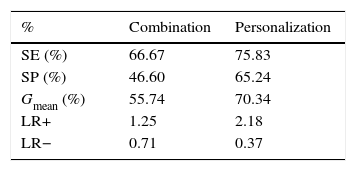
The two methodologies were validated based on 10-fold cross-validation in which the 460 patients were partitioned into 10 folds, each with 46 patients. The training dataset consisted of nine folds, while the remaining fold was used for testing. This procedure was repeated 10 times so that each fold was used for testing once (Table 4).
Performance of the methodologies before optimization.
| % | Combination | Personalization |
|---|---|---|
| SE (%) | 66.67 | 75.83 |
| SP (%) | 46.60 | 65.24 |
| Gmean (%) | 55.74 | 70.34 |
| LR+ | 1.25 | 2.18 |
| LR− | 0.71 | 0.37 |
Gmean: geometric mean; LR+: positive likelihood ratio; LR−: negative likelihood ratio; SE: sensitivity; SP: specificity.
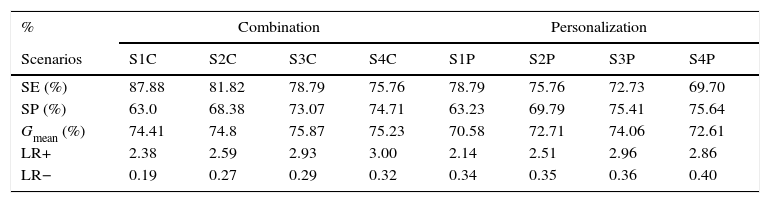
In a second step, an optimization procedure based on genetic algorithms was applied. Table 5 presents the four test cases (scenarios) with the best performance in each approach.
Performance of the methodologies after optimization.
| % | Combination | Personalization | ||||||
|---|---|---|---|---|---|---|---|---|
| Scenarios | S1C | S2C | S3C | S4C | S1P | S2P | S3P | S4P |
| SE (%) | 87.88 | 81.82 | 78.79 | 75.76 | 78.79 | 75.76 | 72.73 | 69.70 |
| SP (%) | 63.0 | 68.38 | 73.07 | 74.71 | 63.23 | 69.79 | 75.41 | 75.64 |
| Gmean (%) | 74.41 | 74.8 | 75.87 | 75.23 | 70.58 | 72.71 | 74.06 | 72.61 |
| LR+ | 2.38 | 2.59 | 2.93 | 3.00 | 2.14 | 2.51 | 2.96 | 2.86 |
| LR− | 0.19 | 0.27 | 0.29 | 0.32 | 0.34 | 0.35 | 0.36 | 0.40 |
C: combination; Gmean: geometric mean; LR+: positive likelihood ratio; LR−: negative likelihood ratio; P: personalization; S: scenario; SE: sensitivity; SP: specificity.
As stated above, the methodologies developed in this study aim to minimize certain limitations of current CVD risk assessment tools, and the availability of validation data focused the validation procedure on secondary prevention, namely for risk assessment of death/myocardial infarction in NSTE-ACS patients over a period of one month.
Thus, the three tools analyzed were applied to the validation dataset. It should be noted that these tools were originally developed with different follow-up periods (GRACE six months, PURSUIT one month, and TIMI 14 days). However, previous studies concluded that these tools perform reasonably well in assessing a period of one month.28
GRACE was the tool with the best performance (Table 3). This result was expected, as the GRACE score is recommended by the clinical guidelines.29 Although its specificity was low, it presented the highest sensitivity as well as the highest geometric mean. This is particularly important, as higher sensitivity is usually more critical than higher specificity; in a clinical context false negatives are usually more important than false positives.30
GRACE also presented the most significant likelihood ratios (positive likelihood ratio 1.76; negative likelihood ratio 0.34).
The combination methodology is intended to improve risk assessment through the combination of the knowledge provided by these three tools. Besides the question of performance, the Bayesian nature of this new model allows the incorporation of clinical knowledge, such as body mass index (a conditional probability table that reflects the prevalence of weight categories as well as the risk associated with each of those categories can be derived and directly incorporated into the overall model). The natural ability of the Bayesian inference mechanism to deal with missing information is another important feature of the proposed approach.
The combination methodology was validated, however the respective results, presented in Table 4, show poor performance. Both sensitivity and specificity, and hence the geometric mean, were lower compared to GRACE. The likelihood ratios converged to 1 (positive likelihood ratio 1.25; negative likelihood ratio 0.71), which confirm the poor performance of the combination scheme.
Like the combination scheme, the personalization approach is based on available risk assessment tools but from a different perspective. Here, the tools are used according to specific groups of patients that are created.
Compared with the GRACE tool, personalization showed better SP and Gmean (65.2% and 70.3%, respectively) but lower SE (75.8%). Analysis of the likelihood ratios indicates a small improvement in the classifier (positive likelihood ratio 2.18; negative likelihood ratio 0.37).
Nonetheless, these results demonstrate that the proposed strategies should be optimized (by adjusting their parameters) to improve their performance.
Optimization based on genetic algorithms produced interesting results. In the combination approach the parameters P(C);P(XGC) were adjusted, producing the results presented in Table 5. For instance, in scenario S3C the values of SE, SP and Gmean (78.8%, 73.1% and 75.2%, respectively) represent a considerable improvement compared with the performance before optimization (66.7%, 46.6% and 55.7%, respectively) as well as with GRACE (81.8%, 53.4% and 66.1%, respectively). The slight reduction in SE is largely compensated by the enhancements in SP and geometric mean. This is confirmed by the new likelihood ratios (positive likelihood ratio 2.93; negative likelihood ratio 0.29).
Optimization of the personalization strategy was applied to the weights of each risk factor, but this was not as effective as in the previous case, and although SE increased, SP fell (Table 5, S1P). The likelihood ratios confirm this (positive likelihood ratio 2.14; negative likelihood ratio 0.34). Here, the most balanced classifier was S3P, with SE, SP and Gmean of 72.7%, 75.4% and 74.1%, respectively, which is also supported by the respective likelihood ratios (positive likelihood ratio 2.96; negative likelihood ratio 0.36). This issue should be investigated further by exploring different parametrizations of genetic algorithms or through the application of alternative optimization algorithms.31
ConclusionsThe results obtained are very encouraging, suggesting that the main goals of this study have been achieved. The methodologies developed enabled improvement of CVD risk assessment performance compared with the current risk assessment tools (in this case applied to secondary prevention). Besides this, the Bayesian nature of the combination methodology allows: (i) the incorporation of current knowledge; (ii) the possibility of incorporating new risk factors; and (iii) the ability to cope with missing risk factors, and ensures the clinical interpretability of the model.
Further research is required not only to strengthen these results but also to improve the proposed methodologies. In this context, the authors are working on ways to merge the two approaches used. However, additional testing datasets are required to improve the development of the proposed algorithms. The availability of data is critical and is the main obstacle to further development of these approaches, as more data would have the positive effects of strengthening validation, improving optimization, enhancing personalization and enabling assessment of the dynamics of risk evolution, for which long follow-up periods are required. Thus, collaboration with clinical partners to obtain additional datasets is crucial and must be a major focus of ongoing research.
Conflicts of interestThe authors have no conflicts of interest to declare.
EU project FP7-216695, coordinated by Philips Research, Aachen; consortium composed of 20 institutions from nine different countries. The combination methodology presented in this work was developed under the scope of the HeartCycle project.
CVD risk assessment models are obtained through the common representation of CVD risk assessment tools (available in the literature).
- High prevalence of cardiovascular disease and risk factors among type 2 diabetes patients followed in a hospital setting in Portugal
- Clinical outcomes of percutaneous coronary intervention in chronic total occlusion in patients with type 2 diabetes mellitus
- Percutaneous coronary intervention in chronic total occlusions: Should it be avoided in type 2 diabetic patients?
- RAAS inhibitors in COVID-19: Not all are created equal. Telmisartan is the one
