
We investigated the relationship between coronary sinus (CS) diameter and pulmonary artery systolic pressure (PASP) in patients with pulmonary hypertension (PH) and normal left ventricular systolic function.
MethodsA total of 155 participants referred for transthoracic echocardiography were included in the study. The study population consisted of 100 patients with chronic PH and 55 control subjects. Patients with PH were divided into two groups according to PASP: those with PASP 36–45 mmHg, the mild PH group (n=53); and those with PASP >45 mmHg, the moderate to severe PH group (n=47). CS diameter was measured from the posterior atrioventricular groove in apical 4-chamber view during ventricular systole according to the formula: mean CS=(proximal CS+mid CS+distal CS)/3.
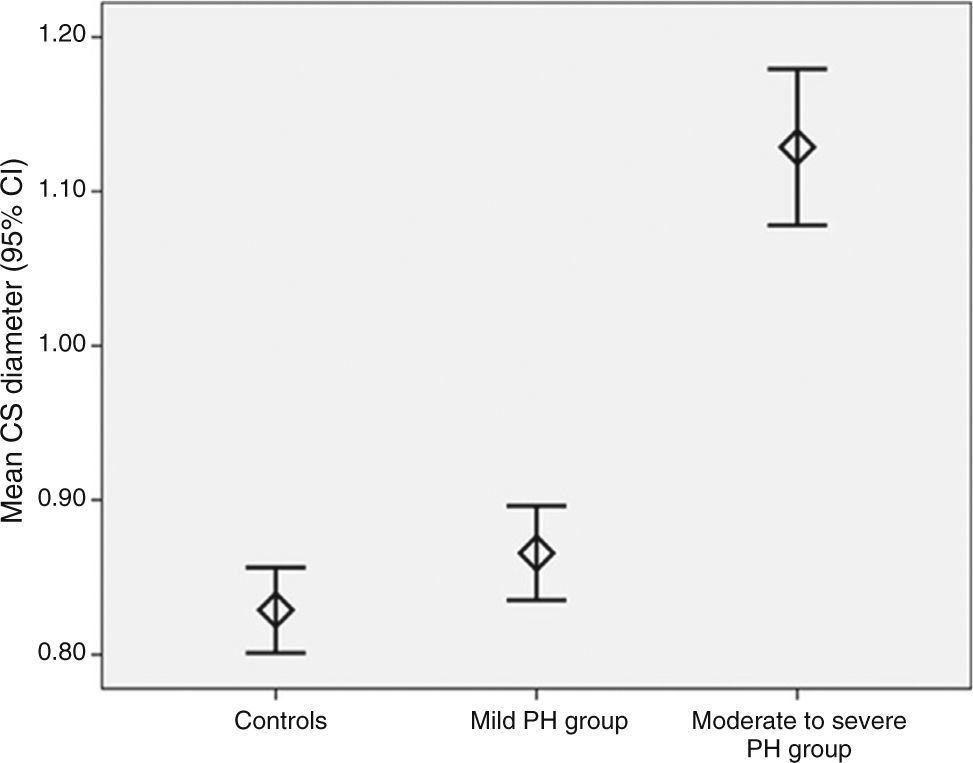
ResultsMean CS diameter was significantly higher in the moderate to severe PH group than in the controls and in the mild PH group (1.12±0.2 cm vs. 0.82±0.1 cm and 0.87±0.1 cm, respectively; p<0.001). It was significantly correlated with right atrial (RA) area (r=0.674, p<0.001), RA pressure (r=0.458, p<0.001), PASP (r=0.562, p<0.001), inferior vena cava diameter (r=0.416, p<0.001), right ventricular E/A ratio (r=−0.290, p<0.001), and E/Em ratio (r=0.235, p=0.004). RA area (β=0.475, p<0.001) and PASP (β=0.360, p=0.002) were found to be independent predictors of CS diameter.
ConclusionsA dilated CS was associated with moderate to severe pulmonary hypertension, and RA area and PASP were independent predictors of CS diameter.
Os autores analisaram a relação entre o diâmetro do seio coronário (SC) e a pressão sistólica arterial pulmonar (PSAP) em doentes com hipertensão pulmonar (HP) que apresentaram funções sistólicas ventriculares esquerdas normais.
MétodosUm total de 155 participantes referidos para ecocardiografia transtorácica foram incluídos no estudo. A população do estudo é composta por 100 doentes com HP crónica e 55 indivíduos no grupo controlo. Os doentes com HP foram divididos em dois grupos de acordo com a PSAP. Os doentes que tiveram PSAP de 36 a 45 mmHg foram definidos como o grupo de HP ligeiro (n = 53) e aqueles com PSAP > 45 mmHg foram selecionados como o grupo de HP moderada-grave (n = 47). O diâmetro do SC foi medido desde o sulco auriculoventricular posterior na incidência apical quarto câmaras durante a sístole ventricular de acordo com a fórmula: media do SC = (SC proximal + SC médio + SC distal)/3.
ResultadosO diâmetro médio do SC foi significativamente superior no grupo da HP moderada –grave do que no grupo controlo e no grupo da HP suave (1,12±0,2 cm versus 0,82±0,1 cm e 0,87±0,1 cm; p <0,001, respetivamente). Verificou-se uma correlação, estatisticamente significativa, com a área da aurícula direita (AD) (r = 0,674, p < 0,001), pressão da AD (r = 0,458, p < 0,001), PSAP (R = 0,562, p < 0,001), veia cava inferior (r = 0,416, p < 0,001), rácio ventricular direito E/A (r = −0,290, p < 0,001) e rácio E/Em (r = 0,235, p = 0,004). Área da AD (β = 0,475, p < 0,001) e PSAP (β = 0,360, p = 0,002) foram encontradas como fatores preditores independentes do diâmetro do SC.
ConclusõesO SC dilatado foi associado à hipertensão pulmonar moderada a grave e a área da AD e da PSAP foram fatores preditores independentes do diâmetro do SC.
Pulmonary hypertension (PH) is routinely diagnosed in cardiology and pulmonary clinics. Chronic PH causes several adaptive changes in the right heart chambers due to pressure overload. Myocardial hypertrophy is the initial adaptive response, followed by progressive contractile dysfunction.1 Chamber dilatation ensues to allow compensatory preload and maintain stroke volume despite reduced fractional shortening. As contractile weakening progresses, clinical evidence of right ventricular (RV) failure occurs, characterized by rising filling pressures, diastolic dysfunction, and diminishing cardiac output.2 As a part of these processes, the inferior vena cava (IVC), which opens into the right atrium (RA), adapts to these changes, which results in reduced collapse with inspiration and dilatation due to pressure overload.
The coronary sinus (CS) is a venous structure that drains myocardial blood primarily from the left ventricle (LV) into the RA, which also receives blood from the IVC. CS diameter has been correlated significantly with pulmonary artery systolic pressure (PASP) in patients with PH resulting from chronic lung disease and LV dysfunction.3 In patients with chronic heart failure (CHF), a dilated CS is possibly a part of the process of cardiac remodeling and may provide useful information to predict the severity of CHF and poor functional class.4 Thus, it is unclear whether the underlying cause of CS dilatation is secondary to PH or a part of cardiac remodeling in patients with CHF.
In our echocardiographic study, we aimed to investigate the relationship between CS diameter and PASP, and to identify predictors of dilated CS in patients with PH.
MethodsStudy patientsThis was a cross-sectional clinical study that included 155 participants in stable sinus rhythm prospectively referred for transthoracic echocardiography (TTE). The study population consisted of 100 patients with chronic PH and 55 control subjects. The study was conducted according to the guidelines of the Declaration of Helsinki and was approved by the local Ethics Committee, and informed consent was obtained from all patients.
Patients with a possible diagnosis of PH resulting from thrombotic and/or embolic disease, left ventricular (LV) systolic dysfunction, LV wall motion abnormalities and/or dilatation, more than mild LV diastolic dysfunction,5 more than mild aortic and mitral regurgitation, or any grade of valvular stenosis, severe tricuspid regurgitation, renal dysfunction (serum creatinine >1.5 mg/dl), cirrhotic liver disease, or inadequate imaging of the coronary sinus (CS) and/or IVC were excluded from the study. The subjects were divided into three groups according to PASP: patients with PASP ≤35 mmHg (control group, n=55), those with PASP 36–45 mmHg (mild PH group, n=53) and those with PASP >45 mmHg (moderate to severe PH group, n=47).6,7 PH was defined as values of PASP >35 mmHg.3,6–8
Echocardiographic measurementsTTE was performed in all patients as a part of the normal clinical examination to clarify the etiology of various symptoms such as shortness of breath or asthenia or reduction in functional capacity to exclude cardiovascular and pulmonary disease, and all patients underwent a comprehensive examination, including M-mode, two-dimensional (2D), conventional Doppler and tissue Doppler echocardiography in partial left decubitus using a GE Vivid E9 system (General Electric, Chicago, IL, USA) with a 2.5–3.5 MHz transducer in accordance with the American Society of Echocardiography (ASE)/European Society of Cardiology (ESC) guidelines.7,9,10 All measurements were obtained by two experienced echocardiographers, blinded to clinical information and using the same measurement protocol, and averaged.
PASP was non-invasively estimated with echo Doppler techniques from peak instantaneous systolic pressure drop from the right ventricle (RV) to the right atrium (RA) and RA pressure (RAP). The RV-RA gradient was estimated by the peak velocity of the tricuspid regurgitant flow signal using the simplified Bernoulli equation (continuous-wave Doppler in apical 4-chamber [A4C] view), while RAP was estimated from end-expiratory diameter and respiratory changes in the IVC in subcostal view.11 A normal IVC diameter (≤2.1 cm) and inspiratory collapse of >50% suggests an estimated RAP of 3 mmHg (range, 0–5 mmHg); a normal IVC diameter without inspiratory collapse of >50% and dilatation (>2.1 cm) with inspiratory collapse (>50%) suggests an estimated RAP of 8 mmHg (range, 5–10 mmHg); and dilatation (>2.1 cm) without inspiratory collapse of >50% suggests an estimated RAP of 15 mmHg.7 PASP was estimated by the formula: 4 v2+RAP.12 The degree of tricuspid regurgitation (TR) was graded as mild, moderate or severe. Mild TR was defined as vena contracta width (the narrowest portion of the jet just downstream from the valve orifice on Doppler echo) of <0.3 cm, and severe TR as greater than 0.7 cm. Moderate TR was defined as a vena contracta width of 0.3–0.69 cm.
Left ventricular ejection fraction (LVEF) was measured from A4C view using the modified Simpson's biplane method.9 RV free wall thickness was measured at end-diastole by M-mode echocardiography from the subcostal window, at the level of the tip of the anterior tricuspid leaflet.7
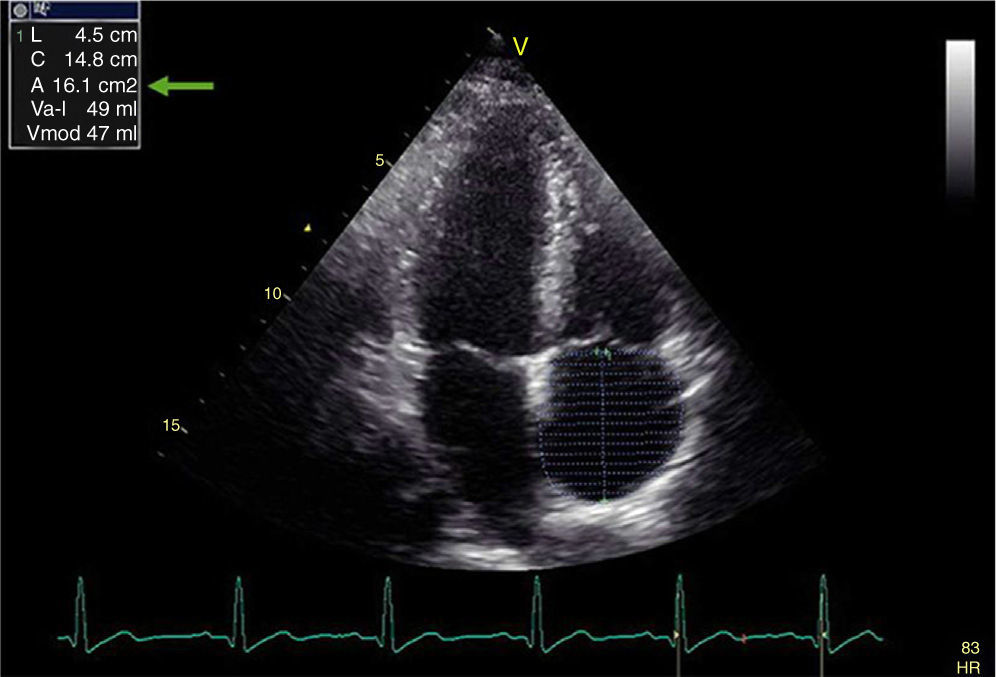
RV end-diastolic and end-systolic area were measured from A4C view using 2D-mode echo7 and fractional area change (FAC) was estimated as (end-diastolic area−end-systolic area)/end-diastolic area×100. Tricuspid annular plane systolic excursion (TAPSE) was measured by positioning the M-mode cursor at the junction of the tricuspid valve (TV) plane with the RV free wall, and was defined as the displacement of the TV plane from end-diastole to end-systole. RV end-diastolic diameters were measured at the inflow tract from A4C view using 2D-mode echo.7 Right atrial (RA) area was estimated by planimetry (Figure 1).7 Body surface area (BSA) was calculated by the Mosteller formula: BSA=square root (height (cm)×weight (kg))/3600.13

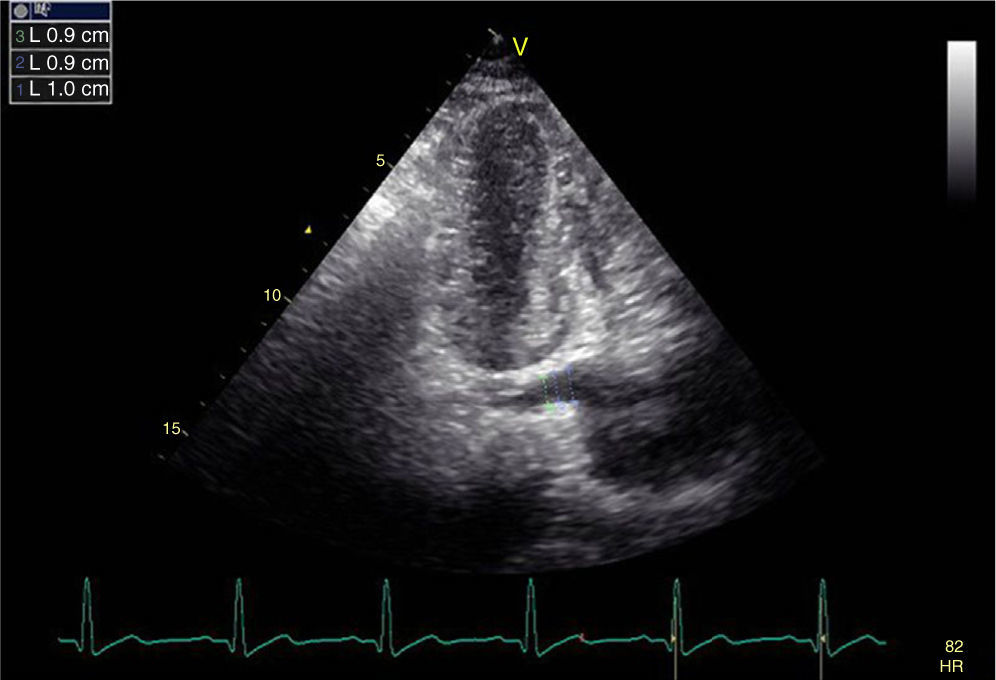
If the transducer is slightly tilted posteriorly to the level of the dorsal wall of the heart in A4C view, the CS and its entry into the RA can be visualized by echocardiography as a sonolucency in the posterior atrioventricular groove. Maximum CS diameter was measured during ventricular systole, since this is when its diameter is at its greatest. Three measurements were obtained, as follows: at the termination of the CS orifice, 1 cm to its left, and between the orifice and the left side origin (Figure 2).4 Mean CS diameter was derived as (proximal CS+mid CS+distal CS)/3. Intra- and interobserver variability were 3.2% and 4.1%, respectively. In order to exclude the existence of a persistent left superior vena cava, agitated saline contrast was injected in a left arm peripheral vein in patients with a large CS (mean diameter >0.8 cm).
 diameter. Three measurements were obtained at the termination of the CS orifice, 1 cm to its left, and between the orifice and the left side origin.")
To measure RV diastolic function, RV inflow was analyzed using pulsed Doppler in A4C view, positioning the sample volume between the tricuspid leaflets at the middle of the tricuspid annulus. The following measurements of RV global filling were determined: E and A peak velocities (in m/s), E/A ratio, and E-wave deceleration time (DT).7 Tissue Doppler was performed using transducer frequencies of 3.5–4.0 MHz, adjusting the spectral pulsed Doppler signal filters until a Nyquist limit of 15–20 cm/s was reached, and using minimal optimal gain. The pulsed Doppler sample volume was subsequently placed at the level of the lateral tricuspid annulus in A4C view. The tissue Doppler pattern of the mitral annulus is characterized by a positive myocardial systolic wave (Sm) and two negative diastolic waves: early (Em) and atrial (Am). Tissue Doppler systolic indices include myocardial peak velocity of Sm (in cm/s), and diastolic indices include myocardial early (Em) and atrial (Am) peak velocities (in cm/s). The E/Em ratio was also calculated.
Statistical analysisContinuous data were presented as mean ± SD and categorical data were expressed as numbers and percentages. The Kolmogorov-Smirnov test was used to assess the normality of the distribution of continuous variables. One-way analysis of variance (ANOVA) with the post-hoc Tukey test or the Kruskal-Wallis test was used to compare the three groups. Categorical variables were summarized as percentages and compared with the chi-square test. Correlation analysis was performed using Pearson's and Spearman's correlation tests. To determine independent predictors of dilated CS, multivariate linear regression analysis was performed including age and parameters with p<0.10. A value of p<0.05 was considered statistically significant. Statistical analyses were conducted using Statistical Package for the Social Sciences (SPSS 17) for Windows (SPSS Inc., Chicago, IL, USA).
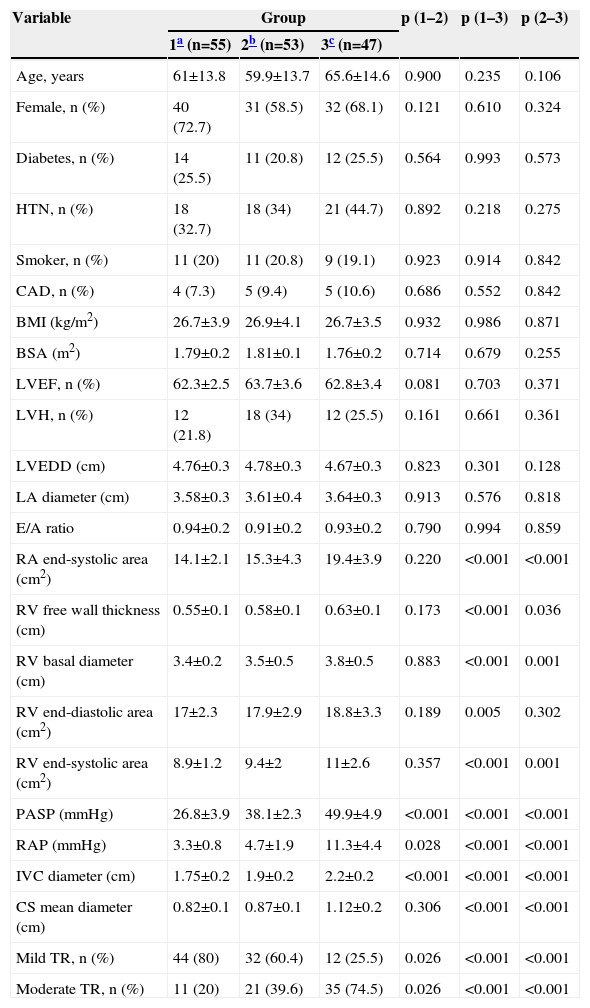
ResultsThe etiology of PH was chronic obstructive pulmonary disease in 84 patients (84%), interstitial lung disease in seven (7%), alveolar hypoventilation disorders in four (4%), sleep-disordered breathing in three (3%), and idiopathic in two (2%). The baseline demographic and echocardiographic characteristics of the three groups are listed in Table 1. There were no significant differences between the groups with respect to baseline demographic characteristics, left ventricular 2D, M-mode and pulsed Doppler echocardiographic findings, or LA diameter. Mean PASP, IVC diameter and RAP were significantly different in each group (p<0.001 for all parameters), while mean RA end-systolic area, RV free wall thickness, RV basal diameter, RV end-diastolic and systolic area, and mean CS diameter (Figure 3) were significantly higher in the moderate to severe PH group.
Baseline demographic and echocardiographic characteristics of the study population.
| Variable | Group | p (1–2) | p (1–3) | p (2–3) | ||
|---|---|---|---|---|---|---|
| 1a (n=55) | 2b (n=53) | 3c (n=47) | ||||
| Age, years | 61±13.8 | 59.9±13.7 | 65.6±14.6 | 0.900 | 0.235 | 0.106 |
| Female, n (%) | 40 (72.7) | 31 (58.5) | 32 (68.1) | 0.121 | 0.610 | 0.324 |
| Diabetes, n (%) | 14 (25.5) | 11 (20.8) | 12 (25.5) | 0.564 | 0.993 | 0.573 |
| HTN, n (%) | 18 (32.7) | 18 (34) | 21 (44.7) | 0.892 | 0.218 | 0.275 |
| Smoker, n (%) | 11 (20) | 11 (20.8) | 9 (19.1) | 0.923 | 0.914 | 0.842 |
| CAD, n (%) | 4 (7.3) | 5 (9.4) | 5 (10.6) | 0.686 | 0.552 | 0.842 |
| BMI (kg/m2) | 26.7±3.9 | 26.9±4.1 | 26.7±3.5 | 0.932 | 0.986 | 0.871 |
| BSA (m2) | 1.79±0.2 | 1.81±0.1 | 1.76±0.2 | 0.714 | 0.679 | 0.255 |
| LVEF, n (%) | 62.3±2.5 | 63.7±3.6 | 62.8±3.4 | 0.081 | 0.703 | 0.371 |
| LVH, n (%) | 12 (21.8) | 18 (34) | 12 (25.5) | 0.161 | 0.661 | 0.361 |
| LVEDD (cm) | 4.76±0.3 | 4.78±0.3 | 4.67±0.3 | 0.823 | 0.301 | 0.128 |
| LA diameter (cm) | 3.58±0.3 | 3.61±0.4 | 3.64±0.3 | 0.913 | 0.576 | 0.818 |
| E/A ratio | 0.94±0.2 | 0.91±0.2 | 0.93±0.2 | 0.790 | 0.994 | 0.859 |
| RA end-systolic area (cm2) | 14.1±2.1 | 15.3±4.3 | 19.4±3.9 | 0.220 | <0.001 | <0.001 |
| RV free wall thickness (cm) | 0.55±0.1 | 0.58±0.1 | 0.63±0.1 | 0.173 | <0.001 | 0.036 |
| RV basal diameter (cm) | 3.4±0.2 | 3.5±0.5 | 3.8±0.5 | 0.883 | <0.001 | 0.001 |
| RV end-diastolic area (cm2) | 17±2.3 | 17.9±2.9 | 18.8±3.3 | 0.189 | 0.005 | 0.302 |
| RV end-systolic area (cm2) | 8.9±1.2 | 9.4±2 | 11±2.6 | 0.357 | <0.001 | 0.001 |
| PASP (mmHg) | 26.8±3.9 | 38.1±2.3 | 49.9±4.9 | <0.001 | <0.001 | <0.001 |
| RAP (mmHg) | 3.3±0.8 | 4.7±1.9 | 11.3±4.4 | 0.028 | <0.001 | <0.001 |
| IVC diameter (cm) | 1.75±0.2 | 1.9±0.2 | 2.2±0.2 | <0.001 | <0.001 | <0.001 |
| CS mean diameter (cm) | 0.82±0.1 | 0.87±0.1 | 1.12±0.2 | 0.306 | <0.001 | <0.001 |
| Mild TR, n (%) | 44 (80) | 32 (60.4) | 12 (25.5) | 0.026 | <0.001 | <0.001 |
| Moderate TR, n (%) | 11 (20) | 21 (39.6) | 35 (74.5) | 0.026 | <0.001 | <0.001 |
BMI: body mass index; BSA: body surface area; CAD: coronary artery disease; CS: coronary sinus; HTN: hypertension; IVC: inferior vena cava; LA: left atrial; LV: left ventricular; LVEDD: left ventricular end-diastolic diameter; LVEF: left ventricular ejection fraction; LVH: left ventricular hypertrophy; PASP: pulmonary artery systolic pressure; RA: right atrial; RAP: right atrial pressure; RV: right ventricular; TAPSE: tricuspid annular plane systolic excursion; TR: tricuspid regurgitation.
Data presented as n (%) or mean ± SD.

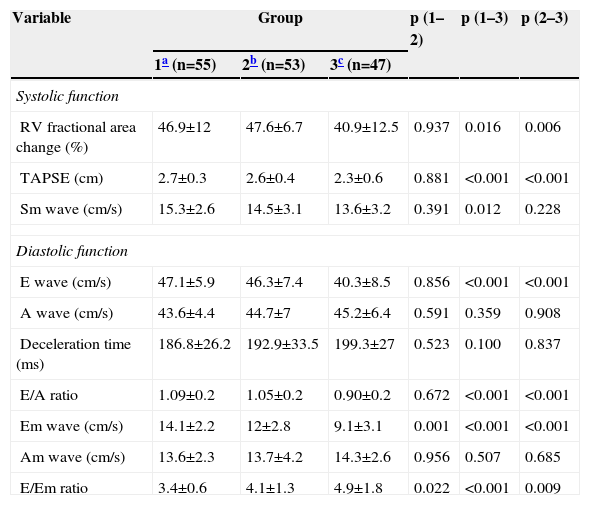
The RV systolic and diastolic function parameters of the study population are shown in Table 2. FAC, TAPSE and Sm wave were significantly decreased in the moderate to severe PH group. Tricuspid inflow A and Am wave were similar between the groups (p>0.05). E wave and E/A ratio were significantly lower in the moderate to severe PH group, whereas E/Em ratio was significantly different in each group (p<0.001), and had the highest value in the moderate to severe PH group.
Right ventricular systolic and diastolic function parameters.
| Variable | Group | p (1–2) | p (1–3) | p (2–3) | ||
|---|---|---|---|---|---|---|
| 1a (n=55) | 2b (n=53) | 3c (n=47) | ||||
| Systolic function | ||||||
| RV fractional area change (%) | 46.9±12 | 47.6±6.7 | 40.9±12.5 | 0.937 | 0.016 | 0.006 |
| TAPSE (cm) | 2.7±0.3 | 2.6±0.4 | 2.3±0.6 | 0.881 | <0.001 | <0.001 |
| Sm wave (cm/s) | 15.3±2.6 | 14.5±3.1 | 13.6±3.2 | 0.391 | 0.012 | 0.228 |
| Diastolic function | ||||||
| E wave (cm/s) | 47.1±5.9 | 46.3±7.4 | 40.3±8.5 | 0.856 | <0.001 | <0.001 |
| A wave (cm/s) | 43.6±4.4 | 44.7±7 | 45.2±6.4 | 0.591 | 0.359 | 0.908 |
| Deceleration time (ms) | 186.8±26.2 | 192.9±33.5 | 199.3±27 | 0.523 | 0.100 | 0.837 |
| E/A ratio | 1.09±0.2 | 1.05±0.2 | 0.90±0.2 | 0.672 | <0.001 | <0.001 |
| Em wave (cm/s) | 14.1±2.2 | 12±2.8 | 9.1±3.1 | 0.001 | <0.001 | <0.001 |
| Am wave (cm/s) | 13.6±2.3 | 13.7±4.2 | 14.3±2.6 | 0.956 | 0.507 | 0.685 |
| E/Em ratio | 3.4±0.6 | 4.1±1.3 | 4.9±1.8 | 0.022 | <0.001 | 0.009 |
Am: myocardial atrial peak velocity; Em: myocardial early peak velocity; Sm: myocardial systolic wave velocity. Other abbreviations as in Table 1.
Data presented as n (%) or mean ± SD.
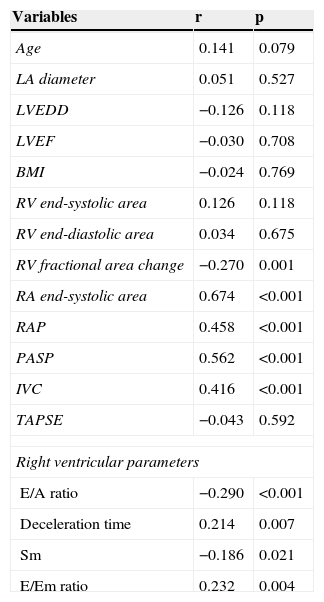
In the correlation analysis, mean CS diameter was significantly correlated with RA area, FAC, RAP, PASP, IVC, LA diameter, right ventricular E/A ratio, DT, Sm wave and E/Em ratio (Table 3). To find independent predictors of CS diameter, a multivariate regression model including age, FAC, RA area, RAP, PASP, moderate TR, IVC, right ventricular E/A ratio, DT, Sm wave and E/Em ratio was constructed. There was no multicollinearity between the selected parameters in the collinearity statistics (lowest tolerance value >0.2). In multivariate analysis, RA area (β=0.475, p<0.001) and PASP (β=0.360, p=0.002) were found to be independent predictors of CS diameter.
Association of mean coronary sinus diameter and other parameters.
| Variables | r | p |
|---|---|---|
| Age | 0.141 | 0.079 |
| LA diameter | 0.051 | 0.527 |
| LVEDD | −0.126 | 0.118 |
| LVEF | −0.030 | 0.708 |
| BMI | −0.024 | 0.769 |
| RV end-systolic area | 0.126 | 0.118 |
| RV end-diastolic area | 0.034 | 0.675 |
| RV fractional area change | −0.270 | 0.001 |
| RA end-systolic area | 0.674 | <0.001 |
| RAP | 0.458 | <0.001 |
| PASP | 0.562 | <0.001 |
| IVC | 0.416 | <0.001 |
| TAPSE | −0.043 | 0.592 |
| Right ventricular parameters | ||
| E/A ratio | −0.290 | <0.001 |
| Deceleration time | 0.214 | 0.007 |
| Sm | −0.186 | 0.021 |
| E/Em ratio | 0.232 | 0.004 |
Em: myocardial early peak velocity; Sm: myocardial systolic wave velocity. Other abbreviations as in Table 1.
To the best of our knowledge, this is the first study investigating the relationship between CS diameter and both RV systolic and diastolic function in patients with PH. The main findings of our study were as follows: (1) as distinct from previous studies, the novel finding was that CS diameter was significantly increased only in patients with moderate to severe PH; (2) CS diameter was correlated with RA area, PASP, RAP, and both RV systolic (FAC, Sm wave) and diastolic parameters (E/A ratio, DT, E/Em ratio); (3) multivariate analysis determined that RA area and PASP were independent predictors of CS diameter.
The CS is a venous structure located in the posterior groove between the LA and LV. It begins as a continuation of the great cardiac vein and opens into the RA between the IVC and the atrioventricular groove. Its branches include the great, small and middle cardiac veins, as well as the posterior vein of the LV. Although it is easy to visualize, assessment of the CS has been overlooked in routine echocardiographic examination. In patients with CHF, Yuce et al.4 demonstrated that CS dilatation may be a part of the cardiac remodeling process, predicting the severity of chronic heart failure and poor functional capacity. Lee et al.14 found a significant correlation between CS diameter and PASP in a study of patients referred for cardiac resynchronization therapy. There have been few studies investigating the association between CS size and PASP in patients with PH according to our literature search. Mahmud et al.15 reported a positive correlation of CS diameter with RA size and RA pressure in patients who underwent echocardiography and right heart catheterization. In a similar population, Isaacs et al.16 investigated the relationship between CS dilatation and pulmonary artery (PA) pressures using chest computed tomography (CT). Right heart catheterization was also performed to obtain right-sided pressures in the study population. They reported that CS dilation was associated with increased PA pressures in patients with PH. Gunes et al.3 reported that CS diameter was increased in patients with PH and significantly correlated with PASP, RAP, right-heart chamber volumes, LVEF, and IVC diameter. In contrast to our work, these study populations included patients with PH due to left-sided heart disease and lung disease, and they did not investigate RV diastolic function. All of these studies examined CS dilatation, although whether the cause of CS dilatation was secondary to increased PASP or a part of cardiac remodeling in patients with CHF remains unclear due to the heterogeneity of the study populations. To address this in our study, we excluded patients with PH resulting from left heart disease. In PH patients with normal LV size and function, mean CS diameter was found to be significantly increased only in patients with moderate to severe PH, and was correlated with PASP, RAP, RA area, and both RV systolic and diastolic function.
CS size and morphology have also been investigated in patients with supraventricular tachycardia and connection of a persistent left superior vena cava to the CS.17–19 Recently, Vatankulu et al.20 reported that the RV myocardial performance index, which represents both systolic and diastolic function, was increased in patients with mitral stenosis and correlated with CS dilatation. In our literature review, we found no studies investigating the relationship between CS diameter and RV diastolic function in patients with PH. However, we determined that CS dilatation was significantly correlated with RV systolic (FAC, Sm wave) and diastolic parameters (E/A ratio, DT, E/Em ratio).
The ASE/ESC guidelines for the echocardiographic assessment of the right heart in adults9 recommend that RA area should be estimated in patients undergoing assessment of RV or LV dysfunction. Although the RA can be assessed from many different views, quantification of RA size is most commonly performed in A4C view.9 Because of the paucity of standardized RA volume data by 2D echocardiography, routine RA volume measurements are not currently recommended.7 It has been shown that RA area, volume and systolic function increase prior to the development of RV dilatation and systolic dysfunction during chronic pressure overload exposure in PH.21 However, RA volume assessment has not been standardized in the same way as LA volume assessment. In our study, RA area was found to be an independent predictor of a dilated CS rather than RAP, which was indirectly calculated by means of the IVC collapsibility index using echocardiography as in clinical practice. In our view, as RAP can fluctuate over time, RA size may be a better measure of mean RAP and CS dilatation. This may explain why RAP did not remain a significant factor in multivariate regression analysis and suggests that increased RA area and impaired venous drainage secondary to increased PASP may lead to CS dilatation in patients with PH.
LimitationsThis was a case-controlled study with a relatively small number of patients. PH is defined as mean pulmonary artery pressure exceeding 25 mmHg at rest as measured by right heart catheterization (RHC).22 However, echocardiography was used in our study to estimate PASP rather than the gold standard of RHC; we could not perform RHC due to ethical concerns. Despite doubts regarding Doppler-derived measurements of PASP,22,23 it can provide an estimate of PASP since it is a readily available and reliable method for serial measurements8 and remains the most effective non-invasive screening tool for the assessment of PH in a clinical setting.24 Additionally, it has been reported that echocardiographic evidence of PH is associated with reduced survival.25
ConclusionIn this study, we determined that mean CS diameter was only increased significantly in patients with moderate to severe PH, and that RA area and PASP were independent predictors of CS diameter in patients with PH. Our data suggest that increased RA area and impaired venous drainage secondary to increased PASP may lead to CS dilatation in patients with PH. Further studies are needed to support these findings.
Ethical disclosuresProtection of human and animal subjectsThe authors declare that no experiments were performed on humans or animals for this study.
Confidentiality of dataThe authors declare that no patient data appear in this article.
Right to privacy and informed consentThe authors declare that no patient data appear in this article.
Conflicts of interestThe authors have no conflicts of interest to declare.
