
Subjects without cardiovascular (CV) disease (CVD) may suffer from subclinical atherosclerosis, and are at increased risk for atherosclerotic CV events (ASCVE). The ESC/EAS risk SCORE was updated by SCORE2, which estimates 10-year risk of fatal and non-fatal CVD in European populations aged 40–69 years without established CVD or diabetes. Our aim was to compare the two ESC/EAS risk scores and to validate SCORE2 in our population.
MethodsA total of 1071 individuals (age 57.2±6.1 years; 75.2% male) without CVD or diabetes, from GENEMACOR study controls, were analyzed over 5.4±3.9 years. The population was stratified into risk categories according to the two scores, and the area under the ROC curve (AUC) and Harrell's C-index assessed the scores’ performance. Calibration was performed using the goodness-of-fit test, and occurrence of the first event assessed by Cox regression. Kaplan–Meier analysis estimated SCORE2 survival.
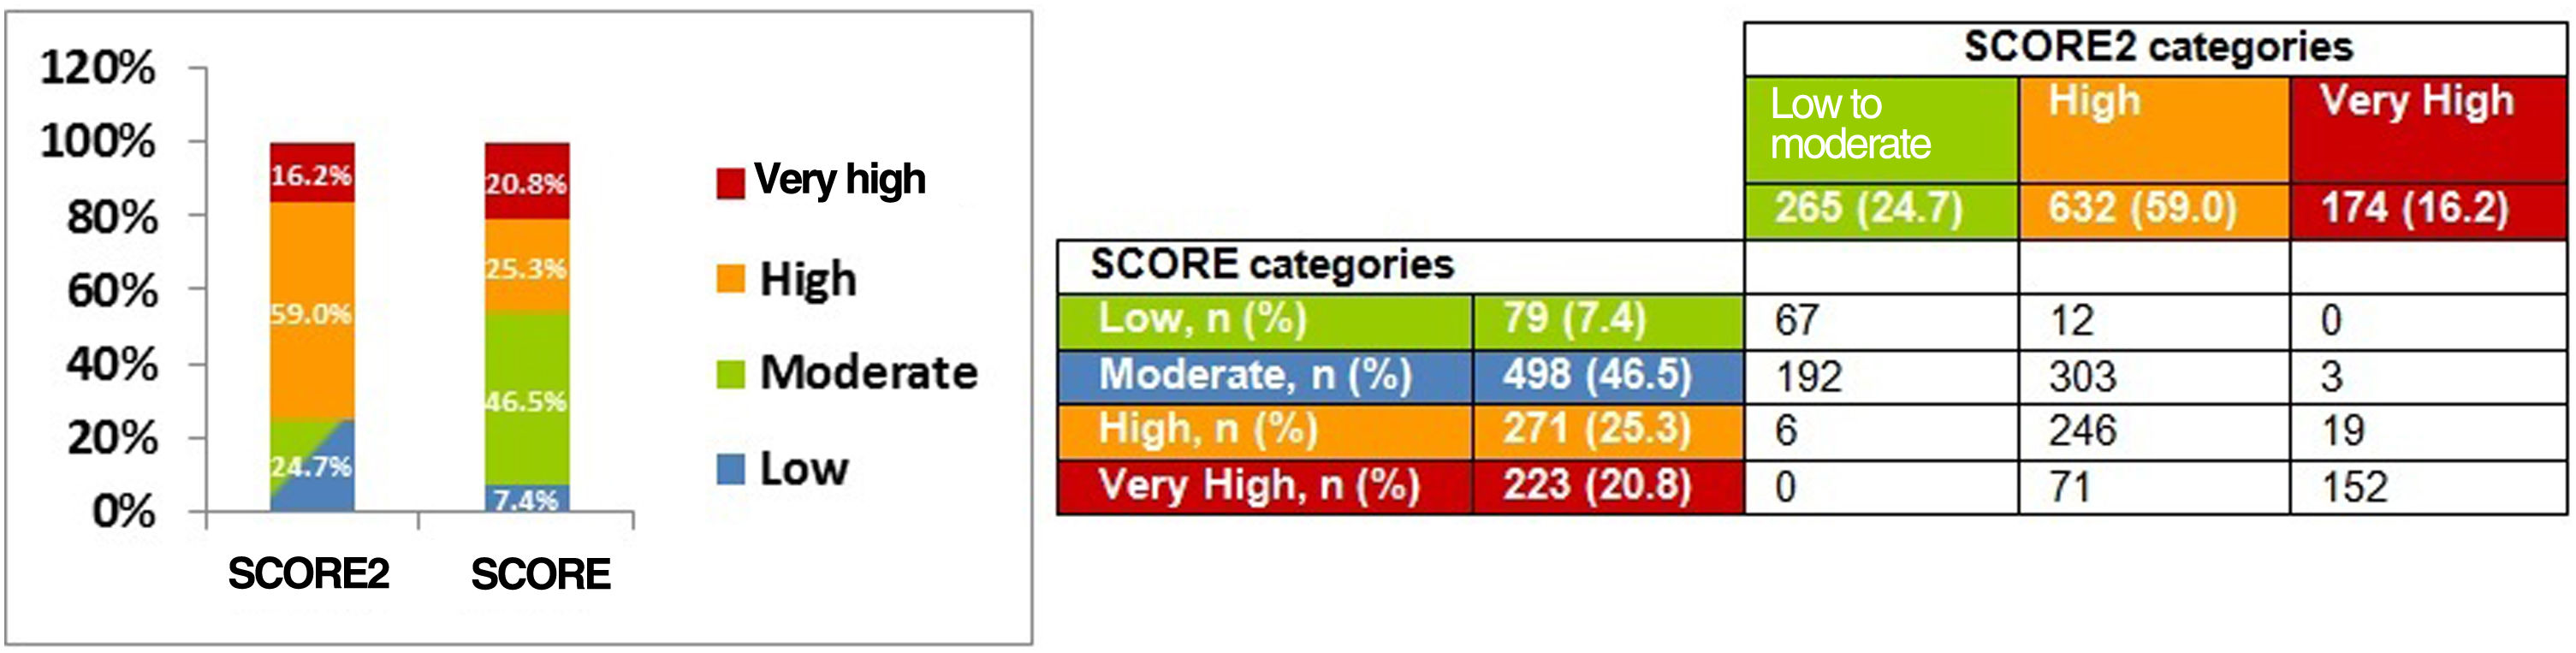
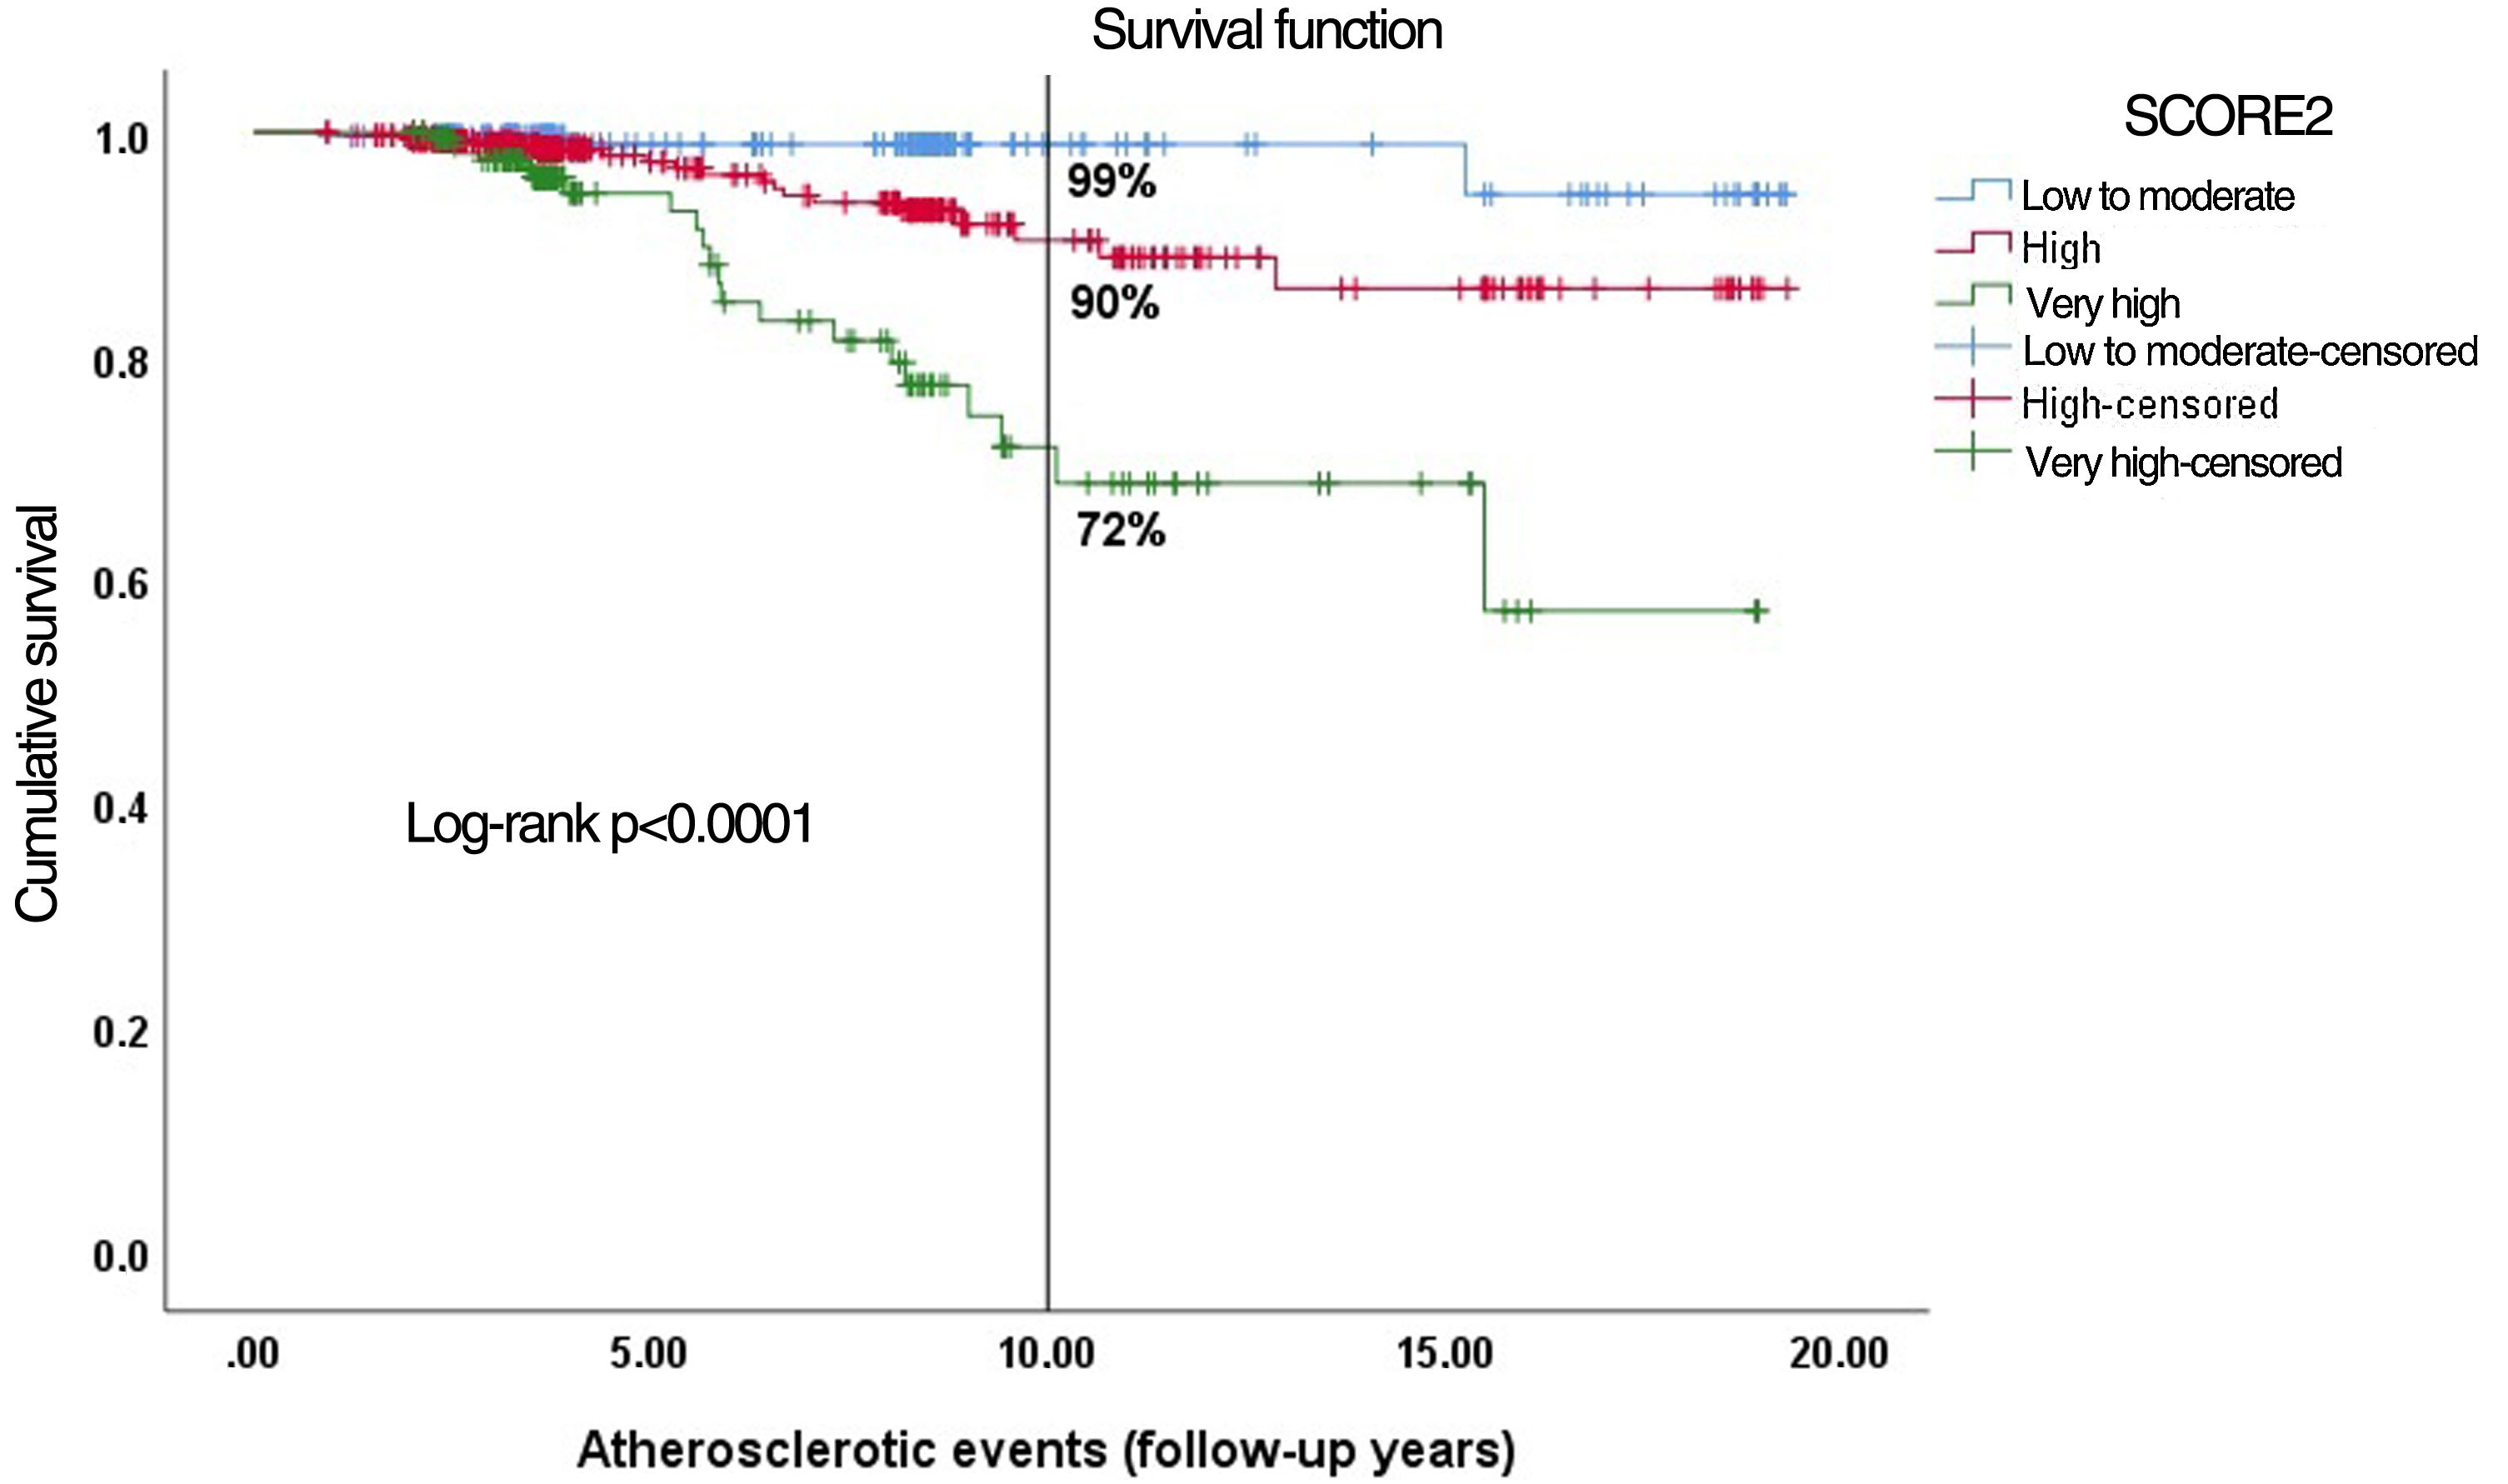
ResultsSCORE stratified subjects into four risk categories: low (7.4%), moderate (46.5%), high (25.3%) and very high (20.8%), and SCORE2 into three: low-to-moderate (24.7%), high (59.0%) and very high (16.2%). SCORE presented good discrimination for CV mortality (AUC=0.838; C-index=0.834, 95% CI: 0.728–0.940), as did SCORE2 for total CV events (AUC=0.744; C-index=0.728, 95% CI: 0.648–0.808). Calibration did not show a disparity between observed and expected ASCVE. The probability of ASCVE was eight times higher in very-high-risk SCORE2 (p=0.001), and three times in the high-risk group (p=0.049). Event-free survival was 99%, 90% and 72% in the low-to-moderate, high and very-high-risk categories, respectively (p<0.0001).
ConclusionsSCORE2 improved population stratification by identifying higher-risk patients, enabling early preventive measures. It showed good discriminative ability for all ASCVE.
Indivíduos sem doença cardiovascular (DCV) sintomática podem sofrer de aterosclerose subclínica tendo risco de eventos cardiovasculares (ECV). O SCORE Europeu foi atualizado pelo SCORE2 que estima o risco de DCV fatal e não fatal a 10 anos, nos europeus entre 40 e 69 anos, sem DCV ou diabetes. O objetivo é comparar estes dois scores de risco, validando o SCORE2 na nossa população.
Métodos1071 indivíduos (57,2 ± 6,1anos; 75,2% sexo masculino), sem DCV ou diabetes, foram seguidos durante 5,4 ± 3,9 anos e estratificados em categorias de risco. O poder discriminativo dos scores para ECV foi estimado pela área abaixo da curva ROC (AUC) e pelo índice C de Harrell. A calibração foi avaliada pelo Hosmer-Lemeshow; o risco de ocorrência do 1.° evento pela regressão de Cox. Kaplan-Meier estimou a sobrevivência do SCORE2.
ResultadosO SCORE estratificou em quatro categorias de risco, baixo (7,4%), moderado (46,5%), alto (25,3%) e muito alto (20,8%) e o SCORE2 em três, baixo-a-moderado (24,7%), alto (59,0%) e muito alto (16,2%). O SCORE apresentou boa discriminação para mortalidade CV (AUC = 0,838; índiceC = 0,834) e o SCORE2 discriminou para a totalidade dos ECV (AUC = 0,744; índiceC = 0,728). A calibração foi adequada. A probabilidade de ECV aumentou oito vezes na categoria de muito alto risco (p = 0,001) e três vezes na de alto risco (p = 0,049). A sobrevivência livre de eventos foi 99%, 90% e 72% nas categorias de baixo-a-moderado, alto e muito alto risco, respetivamente (p < 0,0001).
ConclusõesO SCORE2 melhorou a estratificação ao identificar indivíduos de maior risco, permitindo medidas preventivas precocemente. Mostrou boa capacidade discriminativa para ECV.
Atherosclerotic cardiovascular disease (ASCVD), which includes coronary heart disease (CHD), stroke and peripheral arterial disease, is a major cause of morbidity and mortality, and is among the leading causes of death worldwide.1,2
According to the 2019 Global Burden of Disease Study, the cardiovascular disease (CVD) burden has increased in recent decades. From 271 million in 1990 (95% uncertainty interval [UI]: 257–285 million), prevalent cases of total ASCVD almost doubled, to 523 million in 2019 (95% UI: 497–550 million). The number of CVD deaths rose steadily from 12.1 million (95% UI: 11.4–12.6 million) in 1990, reaching 18.6 million (95% UI: 17.1–19.7 million) in 2019. The global trends for disability-adjusted life years (DALYs) and years of life lost (YLLs) also increased considerably, and years lived with disability (YLDs) doubled from 17.7 million (95% UI: 12.9–22.5 million) to 34.4 million (95% UI: 24.9–43.6 million) between 1990 and 2019.3
An epidemiological study in mainland Portugal in 2016 showed that 15123 deaths were attributable to atherosclerosis (14.3% of overall mortality). DALYs totaled 260943, 75% due to premature death (196438 YLLs) and 25% due to disability (64505 YLDs).4–6 In the Madeira Archipelago (population 250700), a total of 3000 deaths were documented in 2020, 25% of which were due to atherosclerotic CVD.7 Therefore, atherosclerosis imposes a high disease burden on society. However, no recent epidemiological studies have assessed the cardiovascular risk burden in the Madeira population.
A significant proportion of this burden would be avoidable if evidence-based effective and cost-effective interventions, focused on known risk factors, from prevention to treatment, were implemented. Atherosclerotic risk increases with age and in various conditions, such as diabetes, hypertension, dyslipidemia, smoking, physical inactivity, obesity, chronic kidney disease and genetic predisposition.8 Management of modifiable CV risk factors is essential both in people without established ASCVD (primary prevention) and in those with confirmed ASCVD (secondary prevention).9
In 2003, the European Society of Cardiology (ESC), jointly with the European Atherosclerosis Society (EAS), published SCORE (Systematic COronary Risk Estimation), a 10-year risk estimation system for ASCVD death. The SCORE project shared data from 12 European prospective cohort studies from eleven countries, including southern European countries such as Spain and Italy, but not Portugal. SCORE only included fatal CVD outcomes, meaning that it underestimated the total CVD burden including non-fatal outcomes, which are particularly significant in younger people.10 Recently, SCORE was revised to produce a new risk prediction model known as SCORE2, which gives 10-year risk estimates for the combined outcome of fatal and non-fatal cardiovascular events in European subjects aged 40-69 with no prior CVD or diabetes. It was also extended to people over 70 (SCORE-OP). SCORE2 has also been enhanced in its analysis of lipid profile by assessing non-high-density lipoprotein cholesterol instead of total cholesterol, which was used in SCORE. Thus, it better estimates the total burden of ASCVD, especially among younger individuals, and shows better risk discrimination.11,12
With SCORE2, Portugal is now considered a moderate-risk region rather than a low-risk country. Nevertheless, studies to develop the new cardiovascular risk score did not include the Portuguese population, and its validity in this population has not been investigated thoroughly.
ObjectivesThe present study aimed to evaluate the performance of SCORE and SCORE2 models in estimating the 10-year risk of fatal (SCORE) and non-fatal outcomes plus any atherosclerotic CV events (ASCVE) (SCORE2) in individuals without established CVD or diabetes in a Portuguese population from the Madeira Archipelago.
MethodsStudy design and populationA prospective single-center study was performed, including asymptomatic individuals without known coronary artery disease (CAD) and without diabetes who belonged to the control group of the GENEMACOR (Genes in Madeira and Coronary Disease) study.13,14
At screening, residents in the Madeira Archipelago, aged 40–65 years and with no previous history of coronary heart disease, diabetes or stroke, were selected for the study and were followed in our research unit between January 2001 and April 2019. Subjects with missing information (incomplete follow-up) were excluded, resulting in 1071 individuals for this study out of a total of 1491.
Assessment of cardiovascular risk factorsStandard, demographic and clinical variables were compiled, including age, gender, hypertension, smoking status, dyslipidemia, physical exercise level, alcohol intake, family history of premature CVD, and body mass index (BMI).
Smoking status referred to current smokers and was dichotomized as current versus past/never smokers.15
Dyslipidemia was defined as low-density lipoprotein cholesterol >160 mg/dl, non-high-density lipoprotein cholesterol >190 mg/dl, triglycerides >150 mg/dl, or current use of lipid-lowering therapy.16,17
Hypertension was defined as mean systolic blood pressure >140 mmHg and/or mean diastolic blood pressure >90 mmHg18 or blood pressure controlled by antihypertensive therapy.
Family history of premature CAD was defined as one or more first-degree relatives with early CVD (before age 55 years for men and before age 60 for women).19
Alcohol intake was considered significant if >60 g/week in men or >40 g/week in women. Alcohol abuse was defined as an intake of >300 g/week, exceeding two daily drinks.20
Physical inactivity was considered a risk factor when subjects had <40 min of moderate physical activity per day on three days a week (<120 min per week).21
BMI was defined as weight (in kg) divided by the square of height (in m) measured at the time of assessment.22
Calculation of the two predictive algorithms (SCORE and SCORE2)To calculate the ESC/EAS SCORE (2003), we used the chart for low-risk countries (which then included Portugal), stratifying the population into four risk categories: low (<1%), moderate (1% to <5%), high (5% to <10%) and very high (≥10%).11
To calculate the ESC/EAS SCORE2 (2021) in our population, we used the chart for moderate-risk countries, stratifying the population into three risk categories: low-to-moderate (<5%), high (5% to <10%) and very high risk (≥10%). ASCVE during follow-up were analyzed for each risk category.12
Cardiovascular outcomesIn the 2003 SCORE, the predicted outcomes are fatal ASCVE, including death from CAD (acute myocardial infarction and unstable angina), stroke, heart failure or aortic disease.
In SCORE2, predictors assess the risk of a first fatal event or any ASCVE: acute coronary syndrome, stroke, peripheral artery disease, heart failure or atherosclerotic aortic disease.
Statistical analysisTo calculate the sample size, we used the statistical software OpenEpi, through the formula:
where N is the population aged between 45 and 65 years (143811 based on Demographic Statistics of Madeira Archipelago 2020); Z is the critical value according to the established 95% confidence level with margin of error 0.03 (1.96); p is the likely sample proportion (the proportion to be investigated) (86.4%), which is the total ratio minus the diabetic proportion of the Madeira population (13.6%); and e is the acceptable margin of error (0.03) and 95% confidence level.23
This gives the minimum sample size to estimate the appropriate population proportion with the required margin of error and confidence level. The larger the sample size, the greater the certainty that the estimates reflect the population. The narrower confidence interval confirms that our sample size is adequate to represent the whole population of Madeira. Choosing a confidence level of 95% and a margin of error of 0.03, the sample size must be at least 500 individuals.
For binary variables, clinical characteristics were displayed as frequencies. Continuous variables were displayed as mean ± standard deviation; the median was shown in cases of non-normal distribution.
The chi-square test was applied for categorical variables, and the Student's t test or the Mann–Whitney test were used for numerical variables, as appropriate.
To assess the performance of SCORE and SCORE2, we employed predictive and discriminative techniques including receiver operating characteristic (ROC) curves with area under the curve (AUC).24 Harrell's C-index (also known as the concordance index) was used to better discriminate ASCVE, estimating the ability of the two models to differentiate between patients who suffered events and those who did not after the approximate 10-year follow-up period.25 To calibrate the two scores, we used the Hosmer–Lemeshow goodness-of-fit test to assess the discordance between observed and expected ASCVE in the overall population.26 Bootstrapping was performed to assess the internal validity of a predictive logistic regression model, which provides stable estimates with low bias.27
Cox proportional hazard model regression was used to investigate the effect of several variables on the time it took for an event of specific interest to occur (hazard ratio [HR] and 95% confidence interval [CI]).28
Kaplan–Meier survival analysis was used to assess the survival function for each SCORE risk category.29 The probability of ASCVE was analyzed at 10 years of follow-up.
The statistical analysis was performed using IBM SPSS version 25.0 (IBM, Armonk, NY, USA) and R version 4.0.3. All p-values were two-sided and statistically significant for p<0.05.
ResultsCharacteristics of the study population with and without atherosclerotic cardiovascular eventsASCVE recorded in 1071 asymptomatic individuals without established CVD or diabetes were investigated over a period of 5.4±3.9 years (range 0.8–19.3 years).
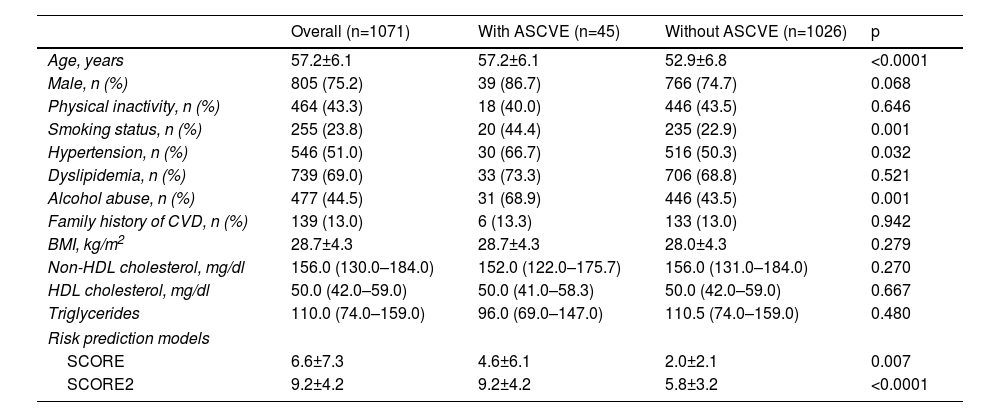
The baseline physical characteristics of the overall study population, with and without ASCVE, are shown in Table 1.
Baseline characteristics of the study population.
| Overall (n=1071) | With ASCVE (n=45) | Without ASCVE (n=1026) | p | |
|---|---|---|---|---|
| Age, years | 57.2±6.1 | 57.2±6.1 | 52.9±6.8 | <0.0001 |
| Male, n (%) | 805 (75.2) | 39 (86.7) | 766 (74.7) | 0.068 |
| Physical inactivity, n (%) | 464 (43.3) | 18 (40.0) | 446 (43.5) | 0.646 |
| Smoking status, n (%) | 255 (23.8) | 20 (44.4) | 235 (22.9) | 0.001 |
| Hypertension, n (%) | 546 (51.0) | 30 (66.7) | 516 (50.3) | 0.032 |
| Dyslipidemia, n (%) | 739 (69.0) | 33 (73.3) | 706 (68.8) | 0.521 |
| Alcohol abuse, n (%) | 477 (44.5) | 31 (68.9) | 446 (43.5) | 0.001 |
| Family history of CVD, n (%) | 139 (13.0) | 6 (13.3) | 133 (13.0) | 0.942 |
| BMI, kg/m2 | 28.7±4.3 | 28.7±4.3 | 28.0±4.3 | 0.279 |
| Non-HDL cholesterol, mg/dl | 156.0 (130.0–184.0) | 152.0 (122.0–175.7) | 156.0 (131.0–184.0) | 0.270 |
| HDL cholesterol, mg/dl | 50.0 (42.0–59.0) | 50.0 (41.0–58.3) | 50.0 (42.0–59.0) | 0.667 |
| Triglycerides | 110.0 (74.0–159.0) | 96.0 (69.0–147.0) | 110.5 (74.0–159.0) | 0.480 |
| Risk prediction models | ||||
| SCORE | 6.6±7.3 | 4.6±6.1 | 2.0±2.1 | 0.007 |
| SCORE2 | 9.2±4.2 | 9.2±4.2 | 5.8±3.2 | <0.0001 |
BMI: body mass index; Cr: creatinine; CV: cardiovascular; HDL: high-density lipoprotein; PWV: pulse wave velocity.
The mean age of the overall population was 57.2±6.1 years and 75.2% were male. A total of 45 ASCVE occurred, among them 13 deaths. Two hundred and fifty-five (23.8%) subjects were current smokers, 51.0% had hypertension and 69.0% had dyslipidemia. Mean BMI was 28.7±4.3 kg/m2; 44.5% were alcohol abusers and 13.0% had a family history of premature CVD.
The group with ASCVE were significantly older (p<0.0001) and presented a higher prevalence of smoking (p=0.001), hypertension (p=0.032) and alcohol abuse (p=0.001). Other risk factors did not show a statistically significant disparity between the two groups. Asymptomatic individuals with higher SCORE and SCORE2 showed higher values in the ASCVE group (p=0.007 and p<0.0001, respectively).
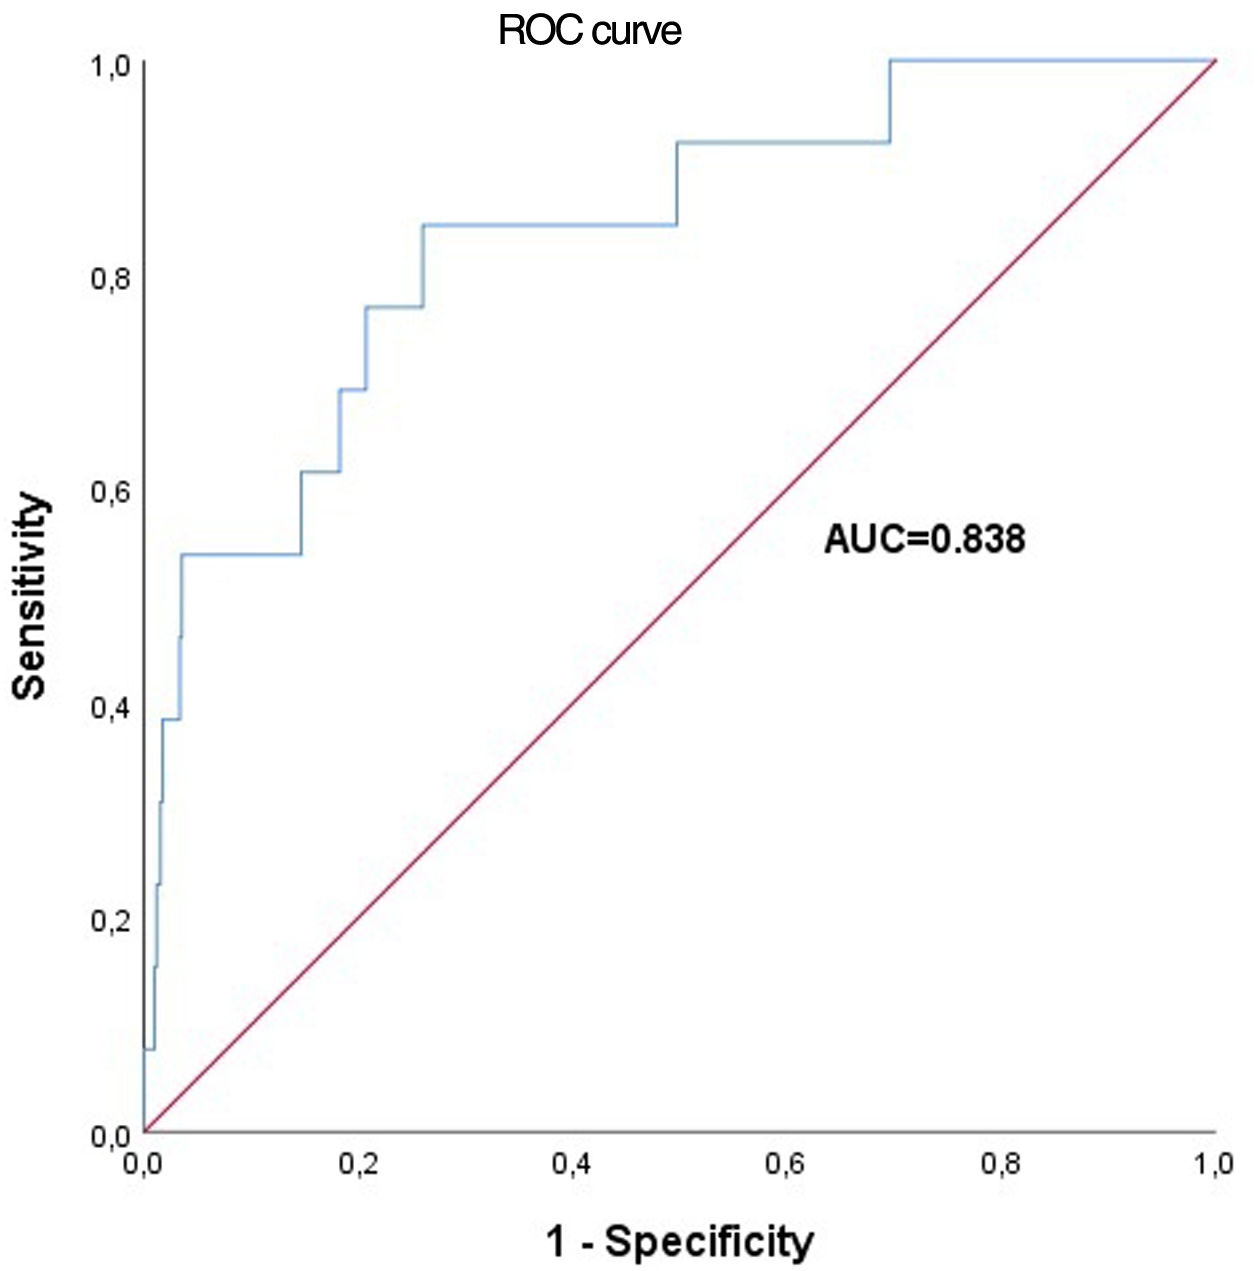
Performance of the two risk scores (SCORE and SCORE2)SCORESCORE was used to calculate the 10-year risk of death from CVD in our populational cohort. A ROC curve was plotted and the respective AUC showed a good value through the relationship of sensitivity versus one minus specificity (AUC=0.838) and C-index=0.834 (0.728–0.940) (Figure 1).
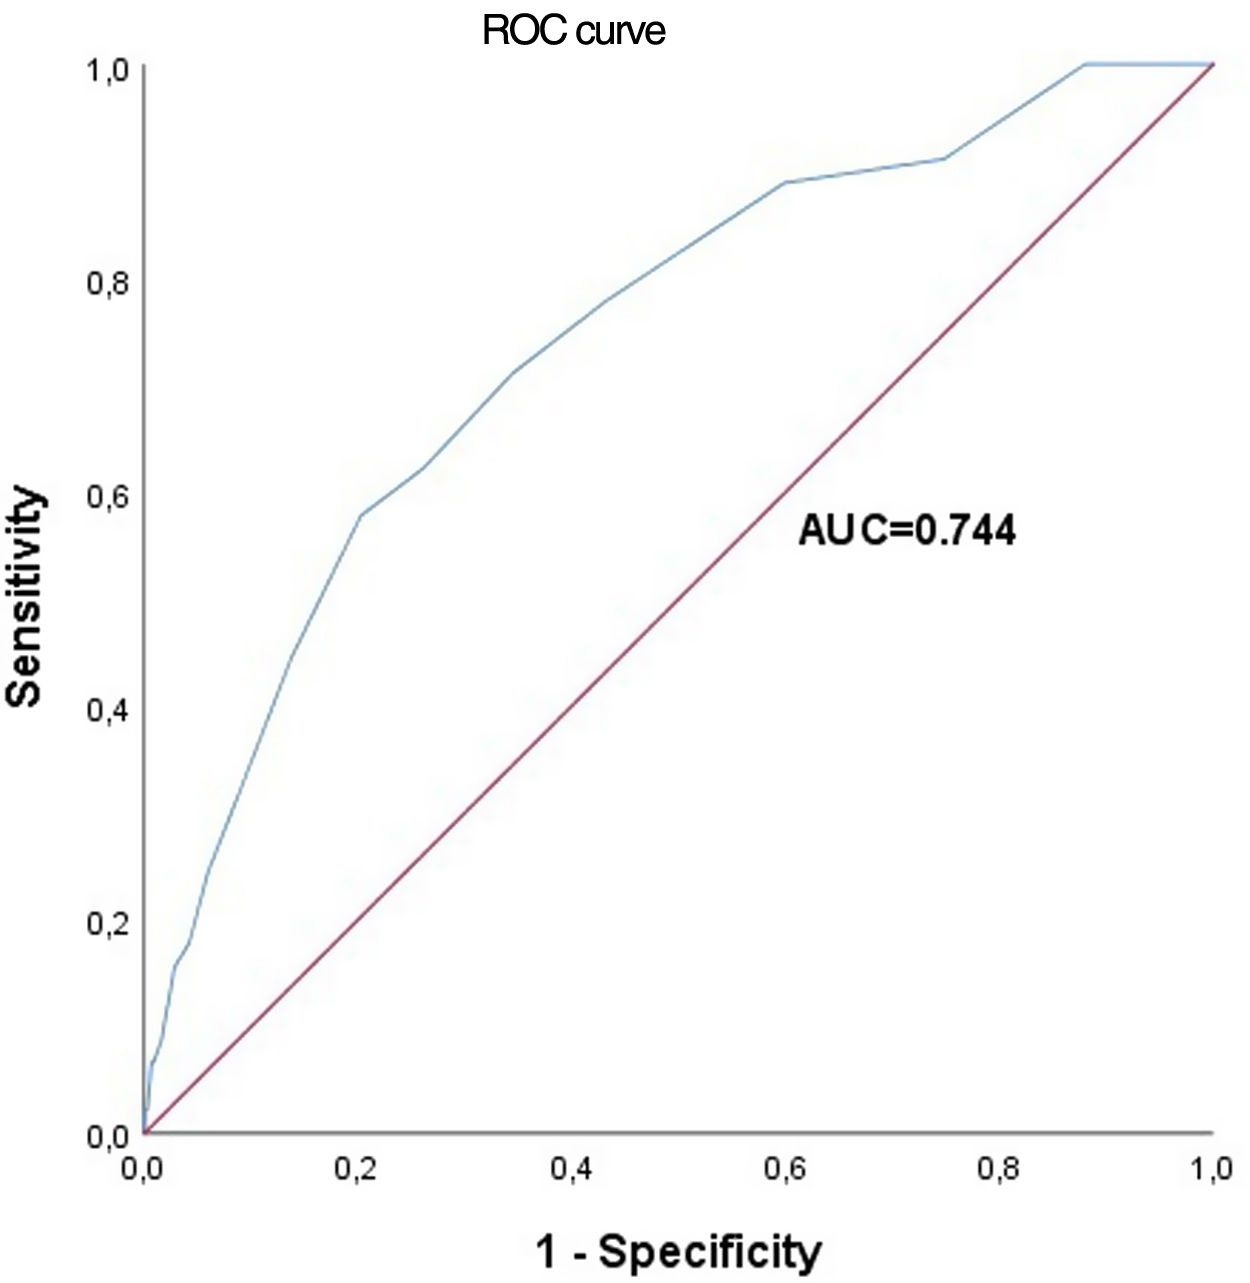
SCORE2
The more recent SCORE2 was used to calculate our cohort's 10-year risk of ASCVE. We plotted a ROC curve and the respective AUC, which showed a reasonable value (AUC for SCORE2=0.744) and C-index=0.728 (0.648–0.808) (Figure 2).
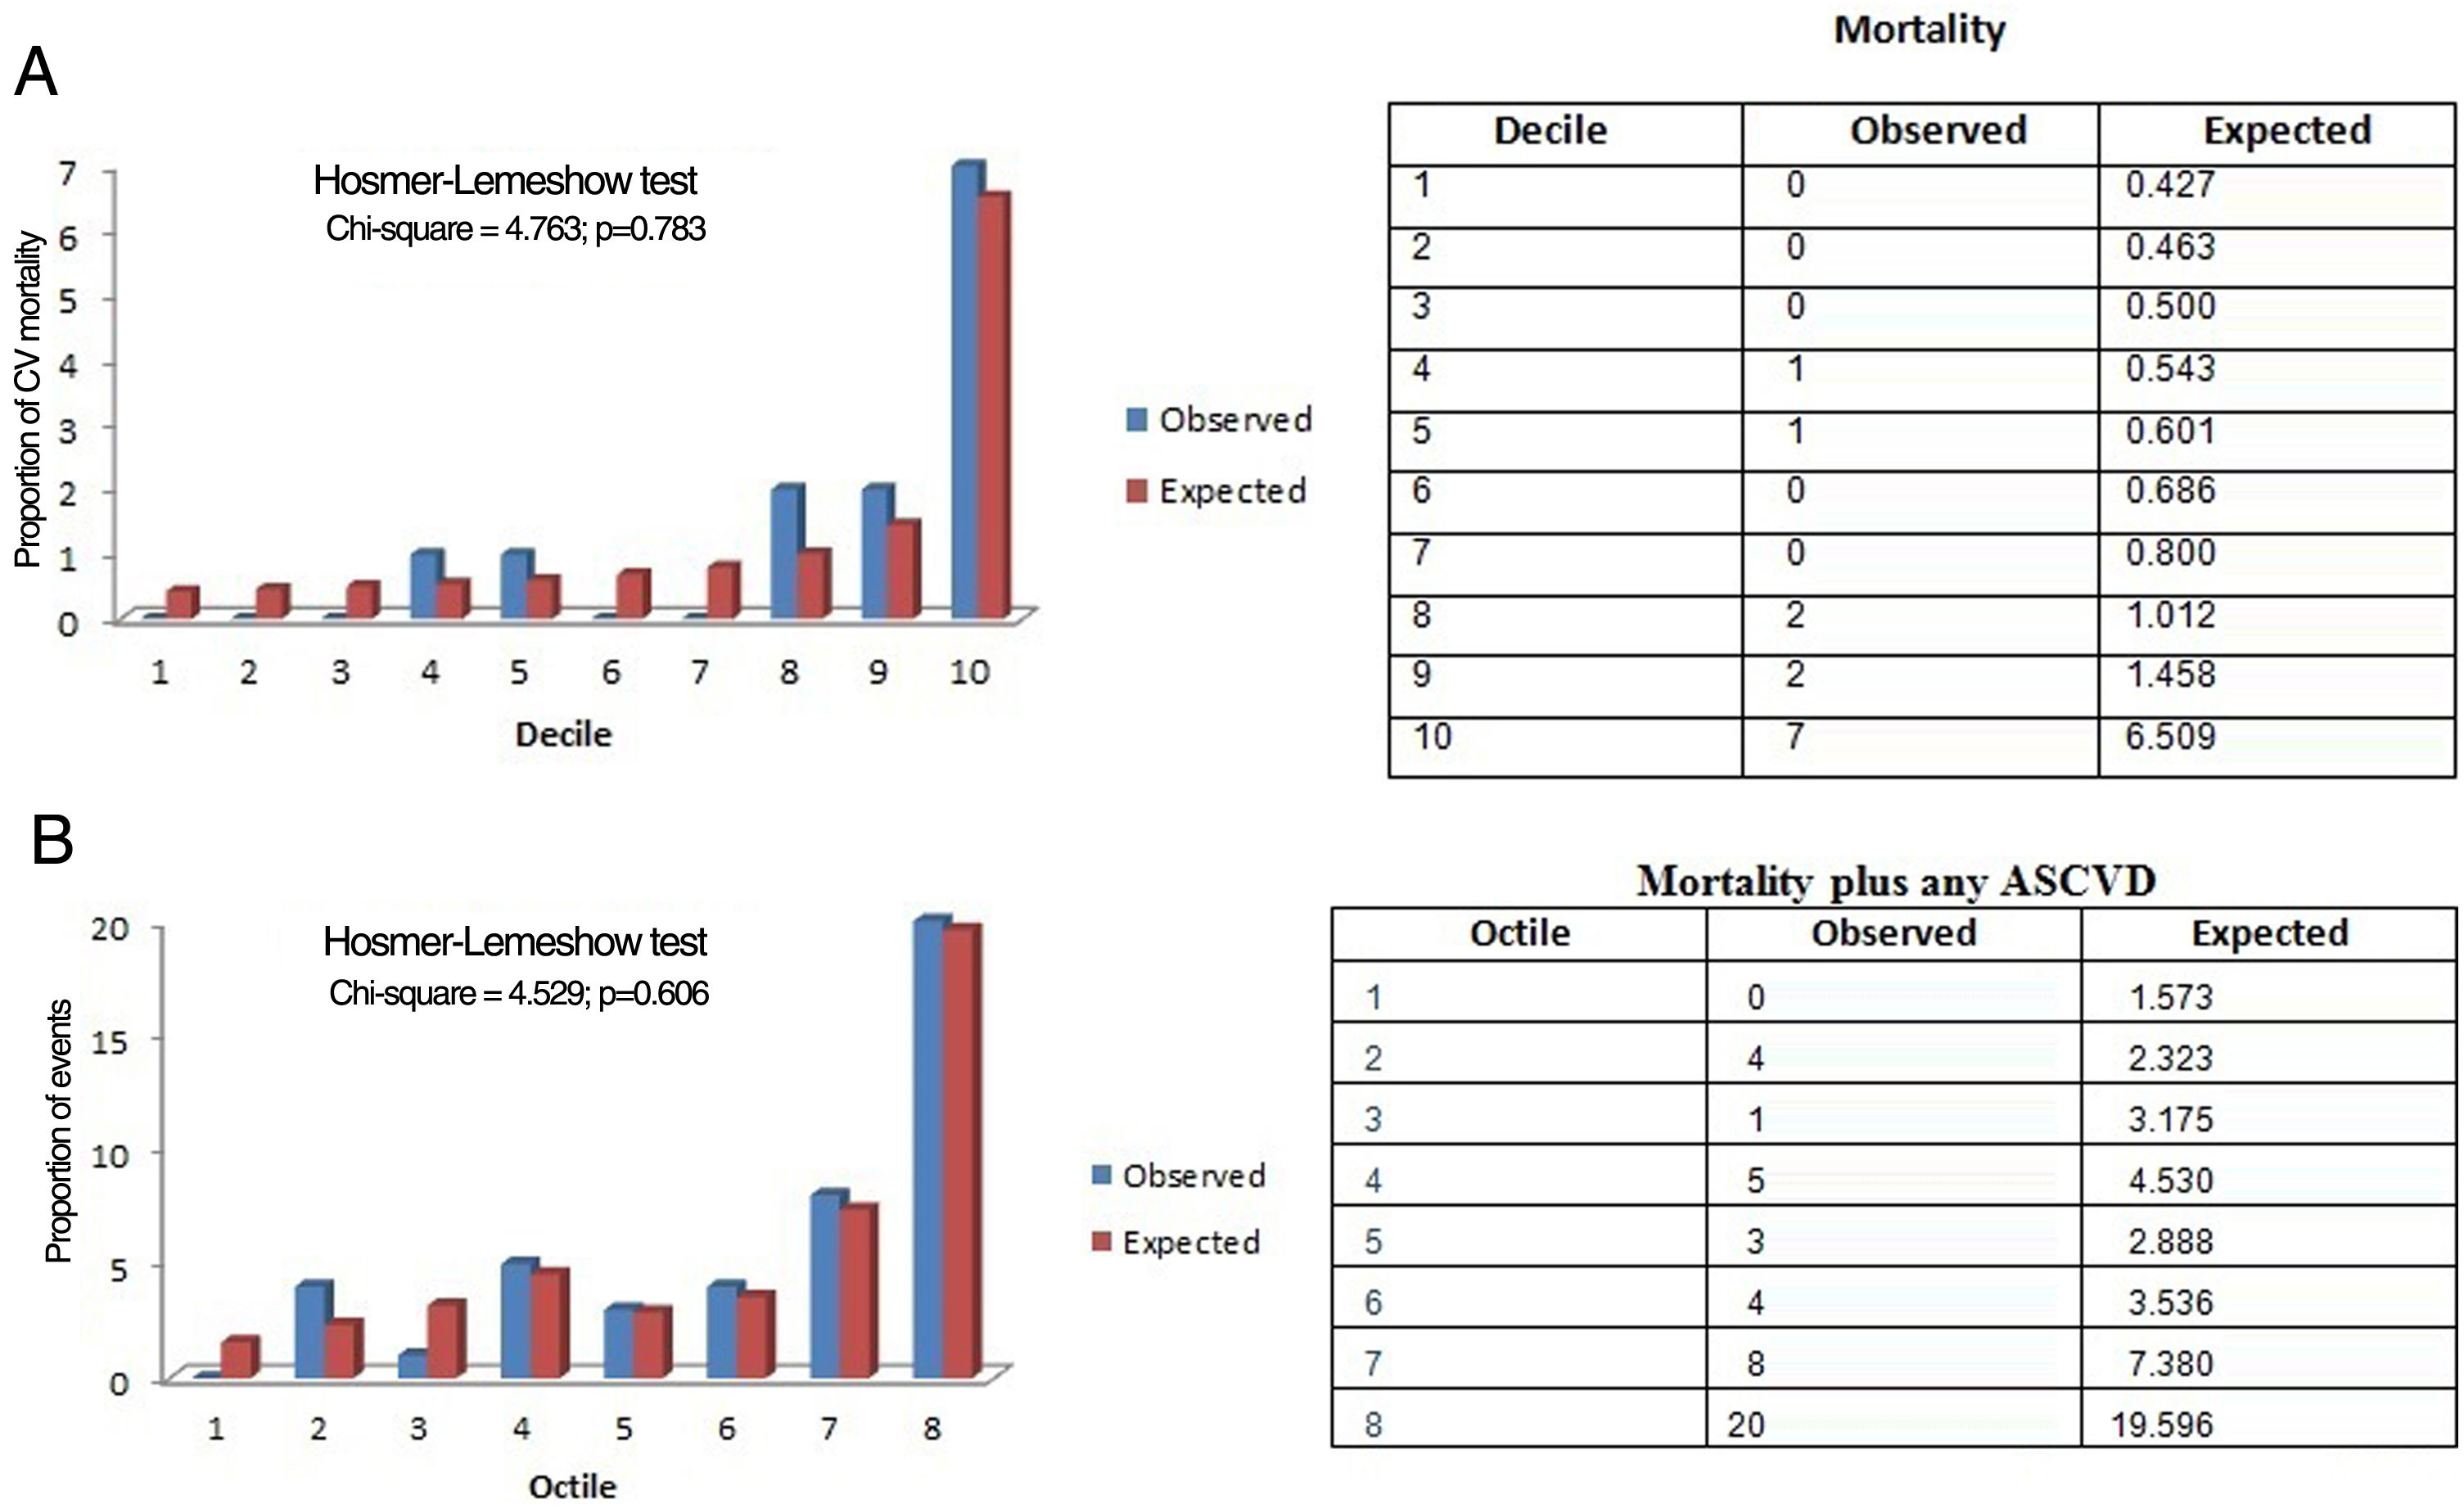
Calibration of SCORE and SCORE2
To calibrate SCORE, we used the Hosmer–Lemeshow goodness-of-fit test, which compares observed with expected data under the model. The chi-square test showed that the model presented a good calibration for our population (chi-square [8 df]=4.763; p=0.783) (Figure 3A). The chi-square test for SCORE2 was 4.529 (p=0.606) (Figure 3B).
Risk stratification of the population with SCORE and SCORE2 SCORE calibration using the Hosmer–Lemeshow test. CV: cardiovascular. (B) SCORE2 calibration using the Hosmer–Lemeshow test. ASCVD: atherosclerotic cardiovascular disease.")
When SCORE was employed to stratify the population, more than half (53.9%) were in the low- and moderate-risk categories, and 46.1% were in the high- and very high-risk groups (Figure 4).

With SCORE2, the low-to-moderate group lost population, totaling 265 (24.7%) of the overall sample. The high- and very high-risk categories accounted for about 806 individuals (75.2% of the total population) (Figure 4).
Probability of atherosclerotic cardiovascular events for the stratified categories (SCORE2)To assess the HRs of SCORE2, Cox regression analysis was used entering SCORE2 categories and adjusting for CV risk factors (age, gender, smoking status, hypertension, dyslipidemia and physical inactivity) for the occurrence of events.
The SCORE2 high- and very high-risk categories presented approximately three and eight times more events, respectively, than the low-to-moderate category at any time (Table 2).
Occurrence of atherosclerotic cardiovascular events in high- and very high-risk SCORE2 categories.
| HR (95% CI) | p | |
|---|---|---|
| Low-to-moderate risk | 1 | 0.001 |
| High risk | 3.368 (0.987–11.493) | 0.049 |
| Very high risk | 8.170 (2.273–29.371) | 0.001 |
| Age | 1.055 (1.001–1.112) | 0.047 |
CI: confidence interval; HR: hazard ratio.
Statistically significant for p<0.05 (forward Wald method).
The highest-risk group had an event-free survival probability of 72%, compared to 99% for the lowest-risk group. The intermediate category showed 90% event-free survival (p<0.0001) (Figure 5).
Discussion
Previous studies estimating CV risk in the Portuguese population are scarce and were conducted mainly in specific subpopulations. The Portuguese Directorate-General of Health's guideline 005/2013, updated on January 21, 2015, recommended using SCORE to assess CV risk in primary and secondary care.30 This recommendation gave rise to the first Portuguese National Health Examination Survey (INSEF), which estimated and categorized 10-year cardiovascular risk in the Portuguese population aged between 40 and 65 years using the SCORE algorithm.31 This survey, which collected data on gender, age, smoking status, total cholesterol and systolic blood pressure, concluded that about 17% of the Portuguese resident population aged between 40 and 65 years were at high or very high risk of suffering a fatal CV event in the following 10 years. However, this was a lower estimate than for the Spanish (22.8% in 2009–2010) and Italian populations (26.0% in 2015), which were also considered low CV risk countries like Portugal. Further studies from other European countries revealed that the SCORE algorithm may overestimate the actual risk of a fatal CV event.32
Moreover, the population had changed since SCORE was developed in 2003, so a recalibration was needed. To improve CV risk stratification, considering both fatal and non-fatal CV events in contemporary European populations, the ESC took on the development, calibration and validation of SCORE2, which set out to assess total atherosclerotic burden. Unfortunately, the studies to develop the new CV risk score did not include the Portuguese population. Therefore, we aimed to calibrate and validate the SCORE2 model for a Portuguese cohort from the Madeira Archipelago without previous CVD or diabetes, aged 40–65 years.
Our results revealed that, although in the high-risk group SCORE2 marginally underestimates the actual risk observed in our population (10%), we strongly consider that SCORE2 could accurately predict and discriminate future CV events in all risk groups of our population. Calibration, which refers to the agreement between the estimated and the real risk of the analyzed outcome, showed a good fit according to our population's actual morbidity and mortality. When we compared expected and observed event rates, there was no divergence between them at 10 years of follow-up.
The more accurate risk estimate using SCORE2 improves the identification of individuals at higher risk of developing ASCVE in this age group (more than 50% of patients are categorized in the high-risk group), providing good risk discrimination compared to SCORE (25.3%). The different risk categories showed clear differences in predicting events at 10 years: the high-risk category had a three times higher likelihood of events and the very high-risk group had eight times more events than the low-to-moderate risk category.
At 10 years of follow-up, the low-to-moderate category had event-free survival of 99% (only 1% risk of CV events), the high-risk group had 90% (10% risk of CV events), and the very high-risk group had an event-free survival of 72%, which corresponds to 28% risk of CV events. It is notable that only in the high-risk category, the SCORE2 algorithm (with a risk prediction of 5 to <10%) slightly underestimates the actual risk observed in our population (10%); in the very high-risk category it accurately predicted the occurrence of events (expected ≥10% CV events), which were observed in 28%. This could lead to earlier and stricter behavioral and medical interventions, such as healthy lifestyle promotion (e.g. smoking cessation) and preventive lipid-lowering, antihypertensive or antithrombotic therapy targeted at these categories. Improving the identification of high-risk patients at the subclinical stage could avoid atherosclerosis progression and occurrence of CV events through earlier implementation of these preventive measures.
In addition, the use of SCORE2 in our population could also reduce overtreatment and side effects for those at lower risk while maximizing timely interventions and financial, health and equity gains for those at higher risk.
Strengths and limitations of the studyThis prospective study included over a thousand individuals who are residents of an island with a single hospital, so we could easily assess all in-hospital events. We were also able to obtain all death certificates of patients who passed away outside the hospital. In these circumstances, the study had access to the follow-up of all individuals included.
Nevertheless, this was a single-center study in Madeira and may not be representative of the overall Portuguese population. Furthermore, we should also acknowledge, as a limitation, the short average follow-up period (5.4±3.9 years). However, with the large sample size (1071 subjects), we were able to analyze a representative number of participants with a complete 10-year follow-up period (n=721).
ConclusionsThe recent SCORE2 improved CV risk stratification in our population, with a significant advance in identifying patients with low-to-moderate, high and very high risk of CV events. The updated SCORE2 algorithm demonstrated strong predictive ability and effective CV risk discrimination for all groups in the middle-aged population of Madeira.
The use of SCORE2 is clinically relevant as it means that with this newer version, higher-risk patients with subclinical atherosclerosis can benefit from earlier and more rigorous CV risk management strategies, in order to prevent future CV events.
Conflicts of interestThe authors have no conflicts of interest to declare.
