The 2021 European Society of Cardiology guidelines on cardiovascular disease (CVD) prevention introduced the more accurate SCORE2 risk model as a replacement for the earlier SCORE, which is still used in primary care software in Portugal. Our objective is to determine whether the difference between risk assessment using SCORE and SCORE2, in the same patient population, is statistically significant.
MethodsA total of 1642 patients aged 40–65 without previous CVD, from the medical records of two Family Health Units, were included in this cross-sectional study. SCORE and SCORE2 were calculated using the variables gender, age, smoking status, lipid profile and systolic blood pressure. A statistical analysis was performed on the results.
ResultsUsing SCORE, 98% of the patients were in the low–moderate risk categories and 2% in the high or very high risk categories. When using SCORE2, the corresponding percentages were 55% and 45%, respectively. Reclassification with SCORE2 into higher categories was more often observed in younger (under 50 years of age) and male patients. With SCORE, 38.61% of patients were within the LDL-C target range; this figure fell to 20.28% with SCORE2. These differences are statistically significant (p<0.0001).
ConclusionOur findings show that a significant number of patients in this cohort who were classified through SCORE at lower risk levels were reclassified into higher risk categories with SCORE2. Similarly, the number of patients within the LDL-C target range for LDL-C was also lower using SCORE2.
As guidelines de 2021 da Sociedade Europeia de Cardiologia sobre prevenção de doenças cardiovasculares (DCV) introduziram um modelo de risco mais preciso (SCORE2) como substituto do anterior (SCORE), que ainda é utilizado no software dos cuidados de saúde primários em Portugal. O nosso objetivo é determinar se a diferença entre a avaliação do risco utilizando SCORE e SCORE2, na mesma população de doentes, é estatisticamente significativa.
Métodos1642 utentes, entre os 40 e os 65 anos, dos processos clínicos de duas Unidades de Saúde Familiar, sem DCV prévia, foram incluídos neste estudo transversal. SCORE e SCORE2 foram calculados utilizando as variáveis sexo, idade, tabagismo, perfil lipídico e tensão arterial sistólica. Foi realizada a análise estatística dos resultados.
ResultadosUtilizando o SCORE, 98% dos pacientes encontravam-se nas categorias de risco baixo-moderado e 2% nas categorias de risco alto ou muito alto. Ao utilizar o SCORE2, as percentagens correspondentes foram de 55% e 45%, respetivamente. A reclassificação com o SCORE2 em categorias mais elevadas foi mais frequentemente observada em doentes mais jovens (<50 anos) e no sexo masculino. Com o SCORE, 38,61% têm o LDL-C dentro do alvo e esse número reduz para 18,4% com o SCORE2. Estas diferenças são estatisticamente significativas (p < 0,0001).
ConclusãoUm número significativo de utentes, classificados em níveis de risco cardiovascular mais baixos com o SCORE, foi reclassificado para categorias de risco mais elevadas com o SCORE2. De igual maneira, o número de utentes com o LDL-C dentro do alvo é menor usando o SCORE2.
Cardiovascular disease (CVD) is an important public health problem worldwide that is responsible for a high proportion of the morbidity and mortality of any given population. Portugal is no exception and in addition to the high prevalence of risk factors for cerebrovascular and cardiovascular diseases, these are not optimally managed, especially hypertension and diabetes.1
The need to account for different populations when estimating cardiovascular risk has led to the development of multiple scoring systems, such as PROCAM, SCORE, QRISK, and the Reynolds risk score. Since 2003, the scoring system recommended by the European Society of Cardiology (ESC) has been Systematic COronary Risk Estimation (SCORE). The SCORE system assesses the 10-year risk of fatal cardiovascular disease for people aged 40 through 65 years.2,3 However, this method underestimates CVD morbidity, as it only targets mortality. In recent decades the focus has shifted toward the prevention of nonfatal outcomes, especially for younger people. In 2021, new ESC guidelines introduced two models to estimate individual 10-year risk of fatal and nonfatal CVD in otherwise healthy people: SCORE2 and SCORE2-OP. The SCORE2 risk model is intended for people aged 40 through 69 years, while SCORE2-OP is used for risk assessment in people aged 70 through 89 years.4
The Portuguese primary health care (PHC) system uses SClínico, developed by the Ministry of Health's Shared Services, as its main clinical support software. This program is used to manage medical appointments, test results and parametric patient data. It is currently used in 300 PHC institutions by 13000 healthcare professionals.5 SClínico currently uses the International Classification of Primary Care, second edition (ICPC-2) for disease coding. This system was developed by the World Organization of Family Doctors (WONCA) and adopted by the World Health Organization. Its main objective is to codify clinical activity in PHC, enabling the use of a common international language by the professionals involved.6,7 Calculation of cardiovascular risk is recommended by the Portuguese Directorate-General of Health's Clinical Guidance Standards.8 In SClínico, the calculation is still performed using SCORE, by inserting the required variables in the fields designed for this purpose. Certain medical conditions, such as myocardial infarction, when present and coded, automatically determine a patient's risk category without the need for the standard variables.
ObjectivesThe aim of this study is to determine whether there is a significant difference in the assessment of cardiovascular risk between the use of the original SCORE scale and the more recent SCORE2 in the same patient population.
MethodsStudy participantsThis cross-sectional study included 1642 patients aged 40 through 65 years. The age range chosen is the one applied for cardiovascular risk assessment using the SCORE scale. Patients were selected from the medical records of two Family Health Units. Data were collected from January 2021 to December 2021. Patients at high or very high risk for CVD due to pre-existing conditions, such as those described below, were not included in the study, since they require specific preventive measures against atherosclerotic CVD and risk assessment tools. Previous CVD, regardless of the vascular territory, i.e. acute myocardial infarction, acute coronary syndrome, coronary revascularization or other arterial revascularization procedures (ICPC-2 codes K74, K75, K76), transient ischemic attack and stroke (K89, K90), diabetes (T89, T90) and glomerular filtration rate <60 ml/min/1.73 m2, were used as exclusion criteria. Since the ICPC-2 code K92 “Atherosclerosis/peripheral vascular disease” includes both CVD that would fall under the exclusion criteria and other phenomena, such as Raynaud syndrome and vasospasm, patients included under it were reviewed individually to assess their eligibility for the study. Furthermore, patients with the K99 code (“Cardiovascular disease, other”) attributed to them due to a diagnosis of aortic aneurysm were identified and individually excluded. Patients with lipid profile values that made it impossible to calculate their SCORE2 or with unavailable variables were not included in the study.
The study protocol was approved by the relevant ethics committee.
Data collectionData were obtained on gender, age, smoking status, lipid profile (total cholesterol, high-density lipoprotein cholesterol [HDL-C] and low-density lipoprotein cholesterol [LDL-C]), systolic blood pressure, and glomerular filtration rate.
In the study, SCORE and SCORE2 were calculated as described elsewhere.3,4 The variables used in the SCORE model are age, gender, systolic blood pressure, total cholesterol and smoking status. The SCORE2 scale uses the same variables, except for lipid profile, for which it uses non-HDL-C. The 10-year risk of cardiovascular death calculated by SCORE is categorized as low (<1%), moderate (1–4%), high (5–9%) or very high (>10%). SCORE2, on the other hand, categorizes 10-year fatal and nonfatal CVD risk into three categories (low to moderate, high and very high). These new risk classifications also vary according to age (low to moderate risk: <2.5% under age 50, <5% ages 50–69; high risk: 2.5–7.5% under age 50, 5–10% ages 50–69; very high risk: >7.5% under age 50, >10% ages 50–69).4
Statistical analysisPatients’ demographic and disease-related characteristics were expressed as mean±standard deviation. The statistical analysis was performed in GraphPad Prism 9 software and IBM SPSS Statistics, version 27. Normality of the variables’ distribution was assessed with the D’Agostino–Pearson test. The means of the groups were compared with the Mann–Whitney test, and the number of users in each category were compared with the chi-square test. The correlation between calculated SCORE and SCORE2 was assessed with Spearman's rank correlation. We also looked at how many patients were within the LDL-C target range according to the SCORE and SCORE2 categories. A p-value <0.05 was considered statistically significant.
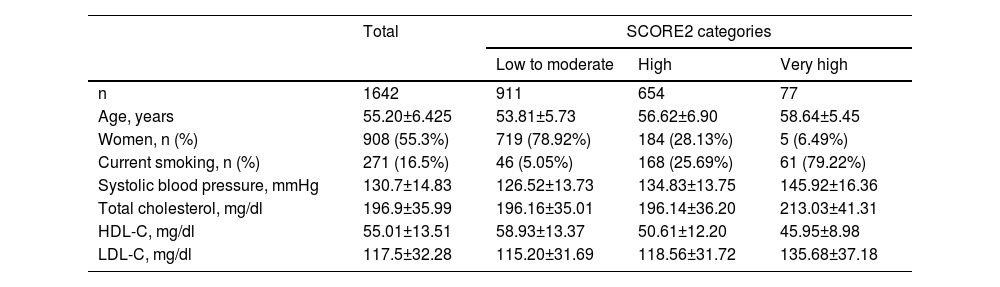
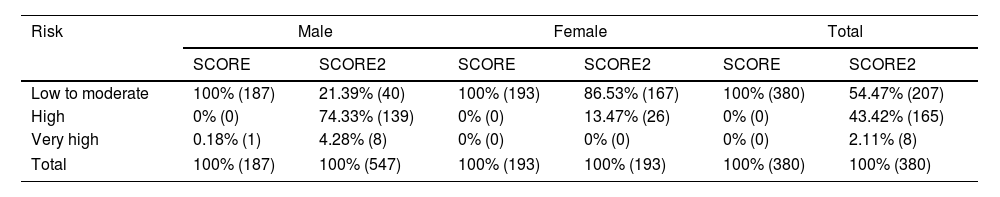
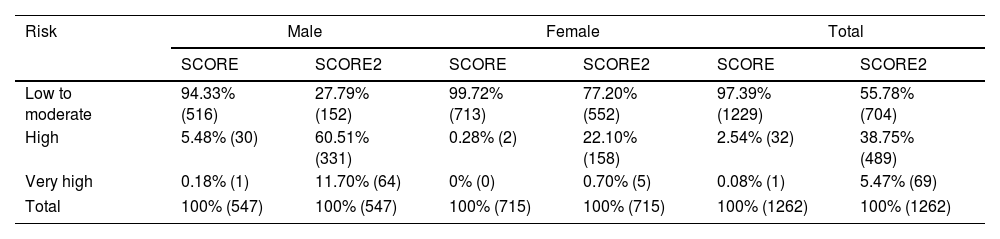
ResultsA total of 1642 patients were included in the study. Most were female (55.3%) and the mean age was 55 years; 16.5% were smokers. Demographic data and cardiovascular risk factors across SCORE2 categories can be found in Table 1. In Tables 2 and 3, we present the distribution of cardiovascular risk categories by gender for patients below 50 years of age and between 50 and 65 years of age, respectively.
Demographic data and cardiovascular risk factors across SCORE2 categories.
| Total | SCORE2 categories | |||
|---|---|---|---|---|
| Low to moderate | High | Very high | ||
| n | 1642 | 911 | 654 | 77 |
| Age, years | 55.20±6.425 | 53.81±5.73 | 56.62±6.90 | 58.64±5.45 |
| Women, n (%) | 908 (55.3%) | 719 (78.92%) | 184 (28.13%) | 5 (6.49%) |
| Current smoking, n (%) | 271 (16.5%) | 46 (5.05%) | 168 (25.69%) | 61 (79.22%) |
| Systolic blood pressure, mmHg | 130.7±14.83 | 126.52±13.73 | 134.83±13.75 | 145.92±16.36 |
| Total cholesterol, mg/dl | 196.9±35.99 | 196.16±35.01 | 196.14±36.20 | 213.03±41.31 |
| HDL-C, mg/dl | 55.01±13.51 | 58.93±13.37 | 50.61±12.20 | 45.95±8.98 |
| LDL-C, mg/dl | 117.5±32.28 | 115.20±31.69 | 118.56±31.72 | 135.68±37.18 |
HDL-C: high-density lipoprotein cholesterol; LDL-C: low-density lipoprotein cholesterol.
Distribution of cardiovascular risk categories by gender of individuals under 50 years of age using SCORE and SCORE2.
| Risk | Male | Female | Total | |||
|---|---|---|---|---|---|---|
| SCORE | SCORE2 | SCORE | SCORE2 | SCORE | SCORE2 | |
| Low to moderate | 100% (187) | 21.39% (40) | 100% (193) | 86.53% (167) | 100% (380) | 54.47% (207) |
| High | 0% (0) | 74.33% (139) | 0% (0) | 13.47% (26) | 0% (0) | 43.42% (165) |
| Very high | 0.18% (1) | 4.28% (8) | 0% (0) | 0% (0) | 0% (0) | 2.11% (8) |
| Total | 100% (187) | 100% (547) | 100% (193) | 100% (193) | 100% (380) | 100% (380) |
Distribution of cardiovascular risk categories by gender of individuals between 50 and 65 years of age using SCORE and SCORE2.
| Risk | Male | Female | Total | |||
|---|---|---|---|---|---|---|
| SCORE | SCORE2 | SCORE | SCORE2 | SCORE | SCORE2 | |
| Low to moderate | 94.33% (516) | 27.79% (152) | 99.72% (713) | 77.20% (552) | 97.39% (1229) | 55.78% (704) |
| High | 5.48% (30) | 60.51% (331) | 0.28% (2) | 22.10% (158) | 2.54% (32) | 38.75% (489) |
| Very high | 0.18% (1) | 11.70% (64) | 0% (0) | 0.70% (5) | 0.08% (1) | 5.47% (69) |
| Total | 100% (547) | 100% (547) | 100% (715) | 100% (715) | 100% (1262) | 100% (1262) |
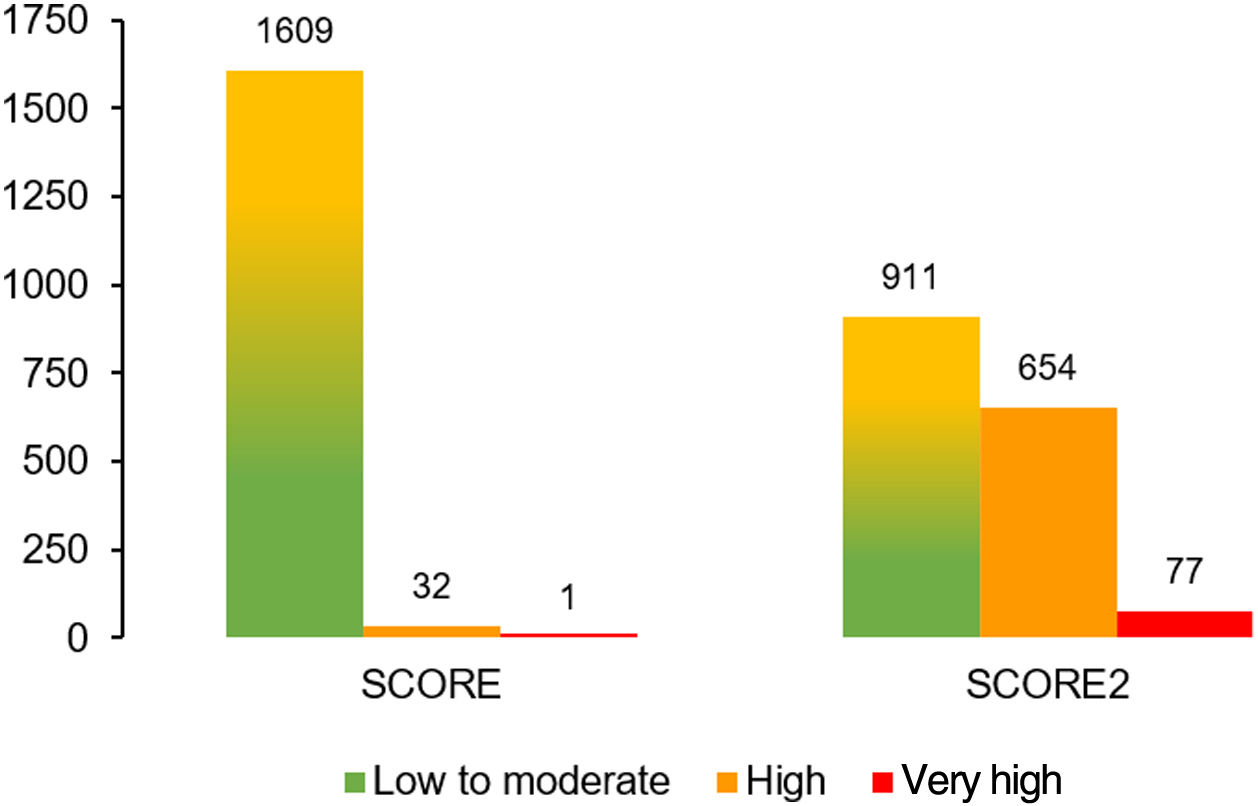
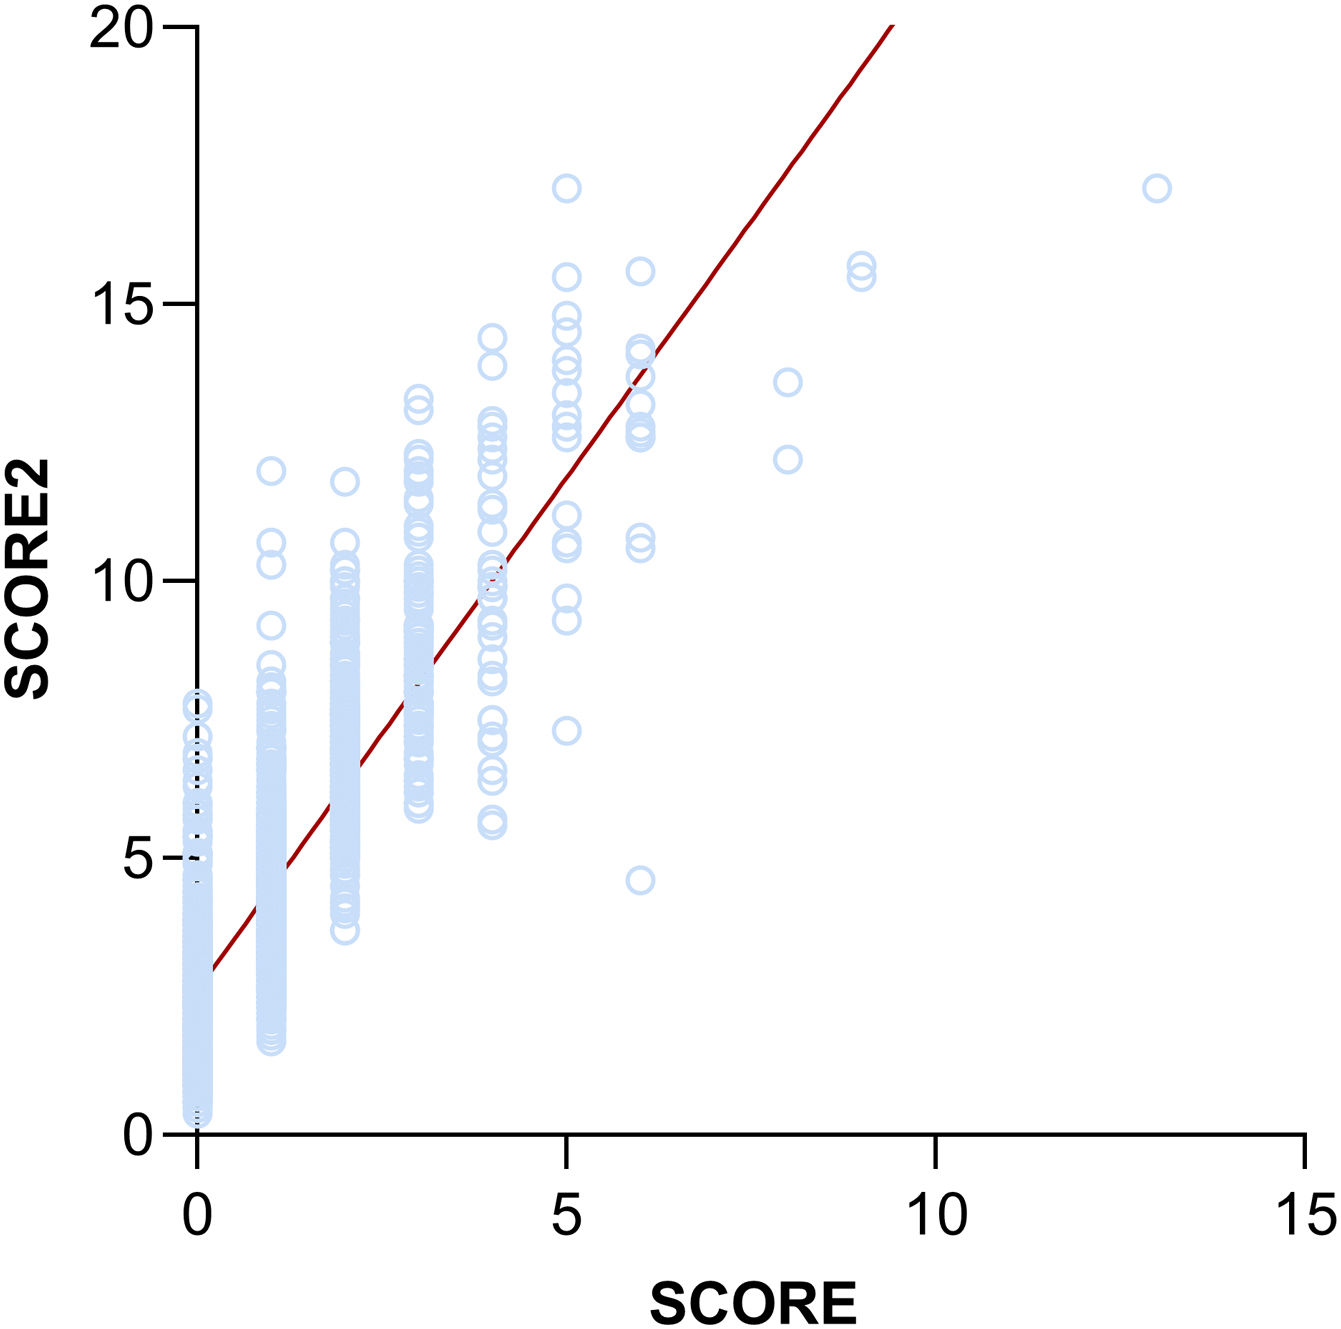
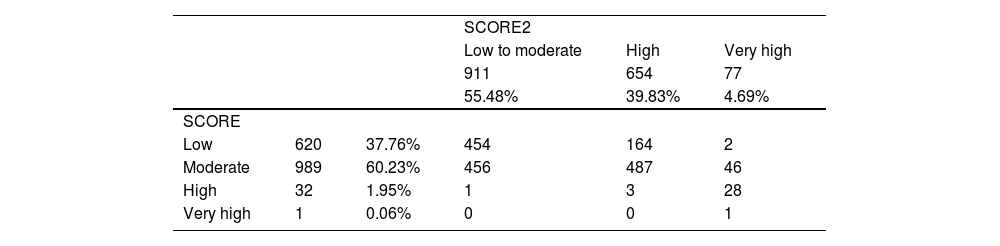
Applying SCORE, as shown in Table 4, 37.76% of patients were categorized as low risk, 60.23% as moderate risk, 1.95% as high risk and 0.06% as very high risk. Using SCORE2, 55.48% of patients were found to be in the low to moderate risk category, and 39.83% and 4.69% in the high and very high categories, respectively. Therefore, using the SCORE scale, 98% of patients were in the low and moderate risk categories and 2% in the high or very high risk categories. Looking at the corresponding categories calculated by SCORE2, the percentages were 55% and 45%, respectively (Table 4 and Figure 1). This difference was statistically significant between the two risk assessment tools (chi-square [2,n=1642] 831.42, p<0.0001). This observation appears to be confirmed by the strong positive correlation between the SCORE and SCORE2 scales (r=0.8225; p<0.0001) (Figure 2).
.")
.")
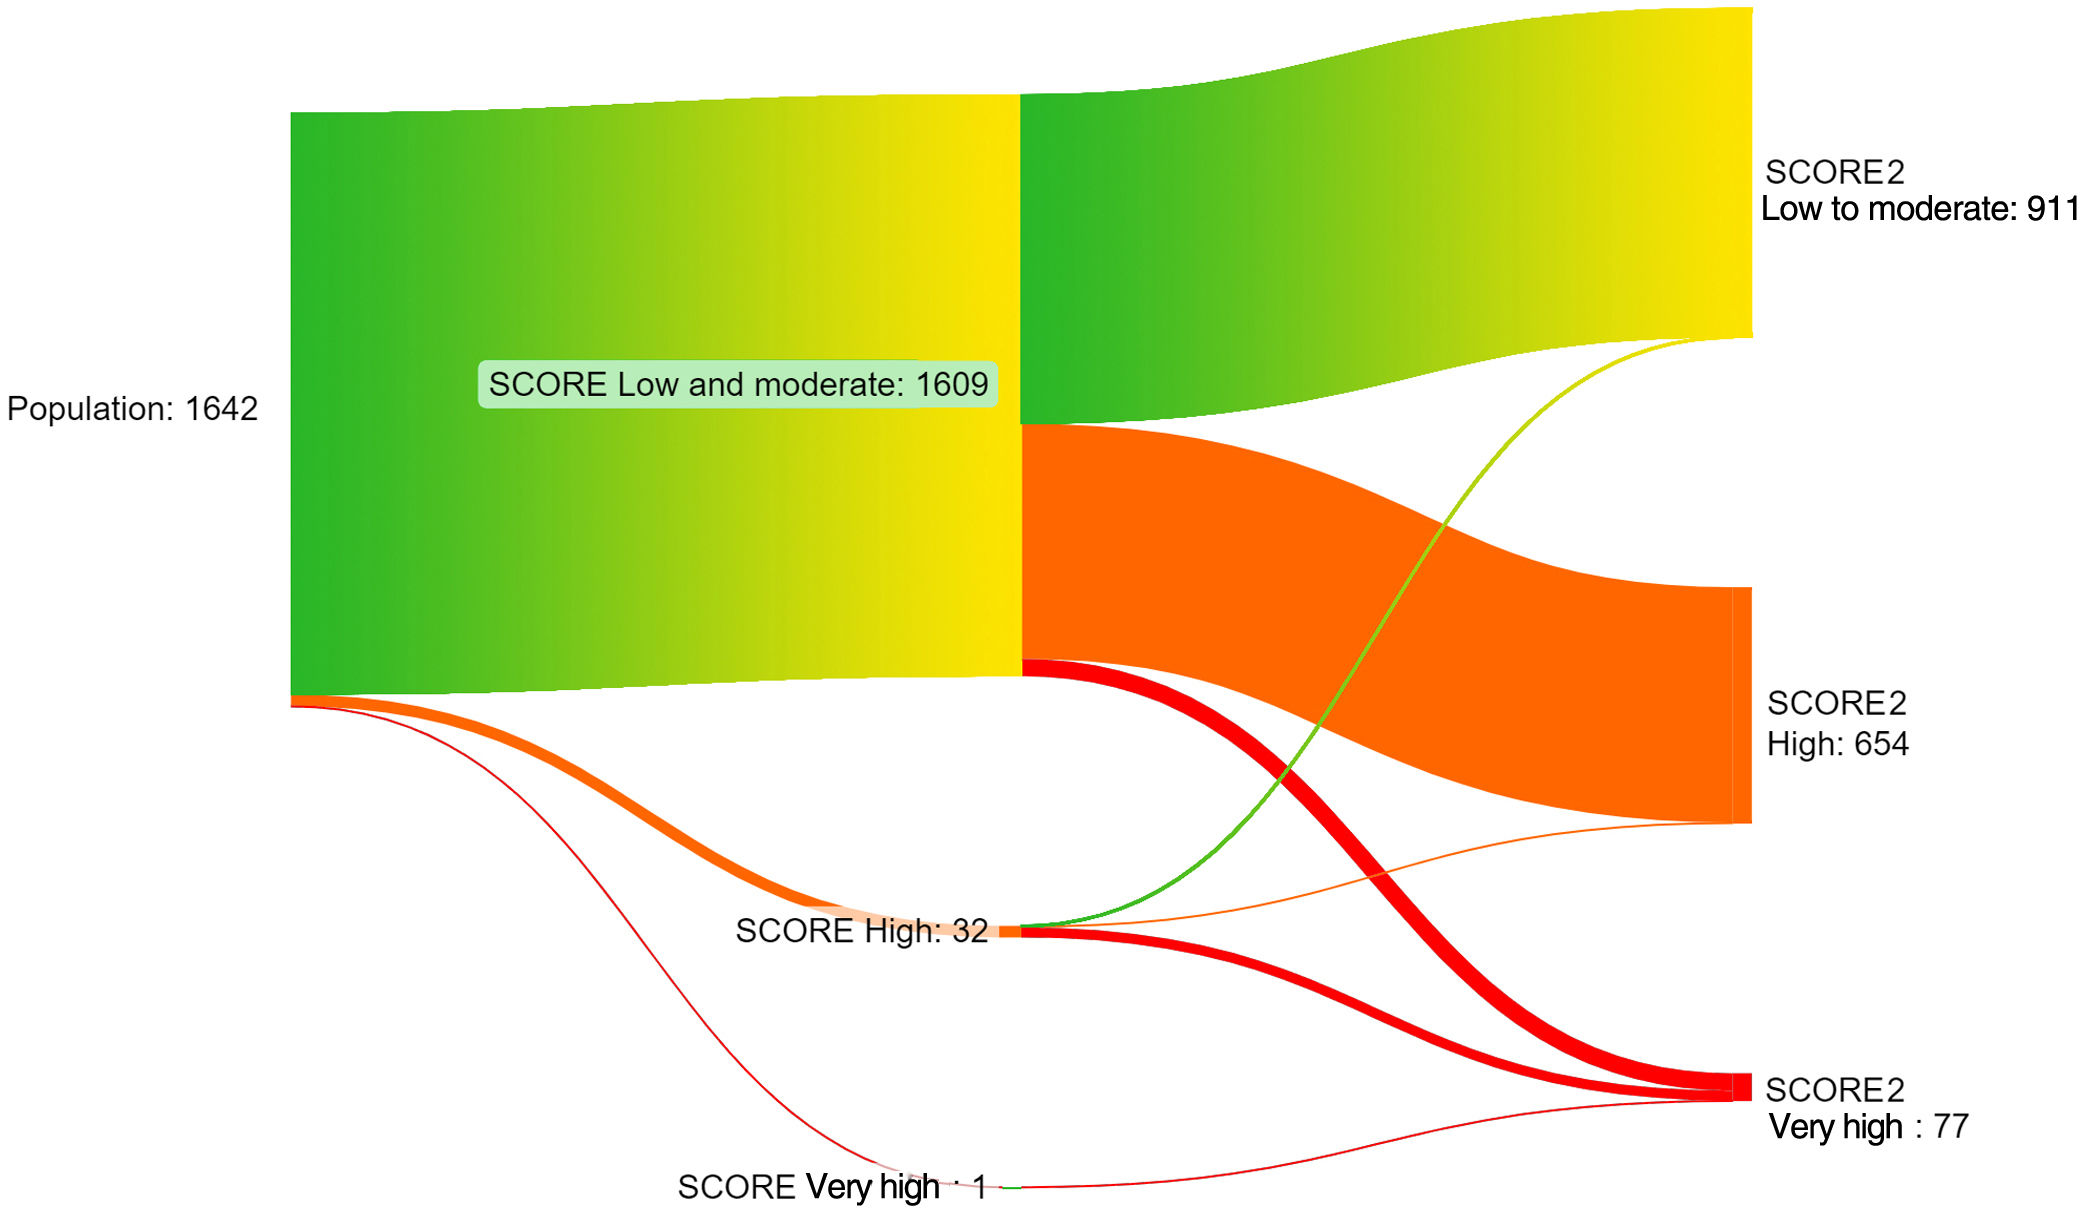
Setting aside absolute numbers and delving deeper (Table 4), it can be seen that the higher the risk category, the larger the percentage of reclassified patients. Of the 620 patients in the low-risk category, 454 stayed in the low to moderate category and 166 (26.7%) were reclassified into the high (164) or very high (2) categories. Of the 989 patients in the moderate category, 456 stayed in the low to moderate category and 533 (53.8%) were reclassified into the high (487) and very high (46) categories. Of the 32 patients in the high category, three stayed in the high category and 29 (90.6%) were reclassified into the low to moderate (one) and very high (28) categories. The only patient in the very high category stayed in the same category. This reclassification is visually represented in a Sankey diagram (Figure 3). For the sake of simplicity, the low and moderate SCORE categories were merged into a low to moderate category, matching the one used in SCORE2.

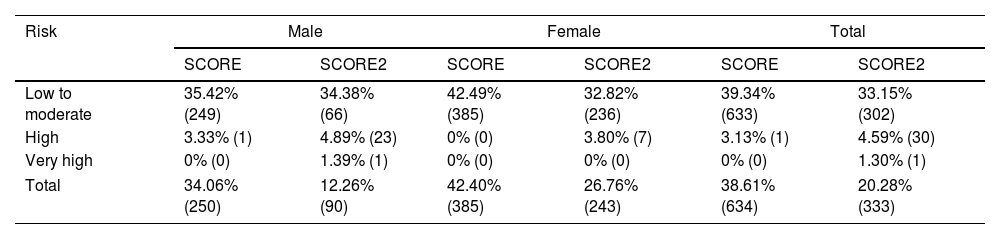
We also analyzed the data to determine the number of patients in the cohort who achieved their target LDL-C level in both scoring systems. The number of on-target patients was higher with SCORE. Out of the 1642 patients, 38.61% reached the desired threshold with the SCORE classification system, compared to only 20.28% with SCORE2. The difference was found to be statistically significant (chi-square [1,n=1642]=662.420, p<0.0001). Further details and a breakdown of cardiovascular risk categories can be found in Table 5.
Distribution of patients within low-density lipoprotein cholesterol target range by gender using SCORE and SCORE2.
| Risk | Male | Female | Total | |||
|---|---|---|---|---|---|---|
| SCORE | SCORE2 | SCORE | SCORE2 | SCORE | SCORE2 | |
| Low to moderate | 35.42% (249) | 34.38% (66) | 42.49% (385) | 32.82% (236) | 39.34% (633) | 33.15% (302) |
| High | 3.33% (1) | 4.89% (23) | 0% (0) | 3.80% (7) | 3.13% (1) | 4.59% (30) |
| Very high | 0% (0) | 1.39% (1) | 0% (0) | 0% (0) | 0% (0) | 1.30% (1) |
| Total | 34.06% (250) | 12.26% (90) | 42.40% (385) | 26.76% (243) | 38.61% (634) | 20.28% (333) |
The 2021 ESC guidelines for the prevention of cardiovascular disease introduced significant changes compared to the previous version. The updated calculator, SCORE2, was recalibrated to four distinct European regions rather than the two-level stratification provided by SCORE, using the most recent and representative CVD rates. Previously, Portugal was classified among the low-risk countries, but new guidelines have now placed it in a category of countries with moderate risk.4 This change implies a significant increase in the potential for CVD.
In our study, the number of individuals considered to be at high or very high cardiovascular risk increased from 2% to 45% with the use of SCORE2. These results are in line with similar European studies, such as in Hungary and Serbia.9,10 This change is noteworthy because it indicates that many patients whose risk would otherwise have been disregarded may require more intensive management of their cardiovascular risk.
With SCORE2, age also plays a significantly greater role in risk classification than in the previous SCORE. The same risk percentage can place patients of different ages in separate categories.4,9 As shown in Tables 2 and 3, reclassification with SCORE2 is more often observed in younger patients (under 50 years of age), from low to moderate to high risk, implying that they will need to be treated more aggressively than before. The shift into higher categories was also more frequent for men than for women, at all ages.
While there is little controversy concerning the recommendation for aggressive treatment of cardiovascular risk factors in patients with high and very high cardiovascular risk, the same cannot be said for patients in the low to moderate risk category. In the latter, we find a tendency to limit initial lipid-lowering therapy to selected cases in which lifestyle modifications, the foundation of any treatment plan for dyslipidemia, are unable to achieve the desired LDL-C target. The challenge of convincing these often young and asymptomatic patients to undergo pharmacological treatment cannot be overstated, and may involve a careful balancing act between patient preference, risk to benefit ratio and economic concerns.
As stated by Figorilli et al.,11 the two guiding principles of cholesterol-lowering therapy should be “the lower the better” for patients at higher cardiovascular risk and “the earlier the better, for longer” for those at lower estimated cardiovascular risk. Accordingly, the LDL-C goal of <116 mg/dl for low-risk subjects, put forward in the 2019 ESC/EAS guidelines, has recently been shifted to <100 mg/dl for the new low to moderate risk category.11
In a previous issue of the Journal, Araújo et al.12 performed a retrospective observational study including very high cardiovascular risk Portuguese patients admitted in two periods: the first two years after the 2011 guidelines were introduced (2011/2012) and five years later (2016/2017). They concluded that even after the introduction of specific LDL-C targets, these were still not reached in most patients. Over a five-year period, lipid-lowering therapy prescription only improved slightly. Thus, regardless of the presence of high cardiovascular risk, the rate of achievement of LDL-C targets is often unsatisfactory. Nowadays, with new, more demanding, guidelines and ambitious targets, aimed at ever younger people with lower cardiovascular risk, the challenge will be even more daunting.
In addition to the analysis of SCORE2 risk estimates, a more holistic, case-by-case assessment may be required, especially for individuals in whom certain factors may play a significant role in altering the absolute value of variables used in CVD risk calculators (e.g. taking lipid- or blood pressure-lowering agents, family history of CVD, chronic kidney disease or being part of at-risk socioeconomic and/or ethnic groups). Nevertheless, it is important to keep in mind that the goal of this study was to assess how the two scores perform in a real-life setting, and not just in individuals who are not yet taking medication to prevent cardiovascular disease.
Additionally, it should be noted that SCORE2 provides risk estimates for the combined outcome of both fatal and nonfatal CVD events, in contrast to SCORE's exclusive assessment of CVD mortality. As a result, more frequent categorization in higher risk brackets might be expected through SCORE2. At first glance this might seem like an ‘apples and oranges’ comparison, but for the clinician, it is of critical importance for the optimization of a patient's short- and long-term quality of life.
We were unable to exclude patients with left ventricular hypertrophy caused by hypertension or with documented significant (≥50%) plaque stenosis, both of which are among the ESC criteria for automatic classification into high and very high CVD risk categories, respectively, because this would have required an individual analysis of diagnostic imaging tests for each participant with hypertension and peripheral vascular disease. This may be considered a limitation of the study.
ConclusionOur findings show that a significant number of patients in this cohort who would be classified by SCORE at lower risk levels were reclassified into higher risk categories with SCORE2. As a better overall tool and considering the practical repercussions, adoption of the SCORE2 scale in the Portuguese PHC system software would enable more accurate assessment of the CVD risk of a significant number of patients, particularly those in lower risk brackets. This is especially important in the PHC system, which is positioned on the frontlines of disease prevention, and particularly in Portugal, where the burden of CVD in negative outcomes is still overwhelming. While delving into this analysis, we also found that a large proportion of patients were above the desired LDL-C target for their category, even more so when using the more stringent SCORE2, which should and will have immediate practical effects in the healthcare units involved.
Therefore, we believe the clinical support software SClínico should be updated as soon as possible, replacing SCORE with SCORE2, which would enable more rigorous and reliable assessment of the cardiovascular risk of each individual. We consider this to be one of the most important preventive strategies that can be implemented in order to reduce long-term morbidity and mortality associated with CVD.
Conflicts of interestThe authors have no conflicts of interest to declare.
We thank Prof. Luiz Santiago, Mário Cosme, Conceição Saraiva, and Raquel Silva Alves.
