
The spectrum of hypertensive heart disease is wide, and can include left ventricular dysfunction. The development of echocardiographic parameters to improve patient stratification and to identify early adverse changes could be clinically useful.
AimTo identify subclinical left ventricular dysfunction in hypertensive subjects with preserved ejection fraction (>55%), identified by global parameters of myocardial strain on speckle tracking imaging.
MethodsThis was a comparative observational study of two groups of individuals: normotensive (n=20, age 59±7 years, 55% male) and hypertensive (n=229, age 62±12 years, 57% male). Left ventricular function was assessed by various conventional clinical and echocardiographic parameters and global longitudinal and circumferential myocardial strain. Cut-off values to detect subclinical left ventricular dysfunction were established and applied in the hypertensive group. The Student's t test, Mann-Whitney test and chi-square test were used for the comparative statistical analysis.
ResultsMost hypertensive subjects (53.7%) had grade I hypertension; blood pressure was controlled in 64.9%, and 54.8% showed left ventricular structural changes. Comparison between the normotensive and hypertensive groups showed no significant differences in parameters of global longitudinal or circumferential systolic strain. Application of the cut-offs to the hypertensive group identified 35 individuals (15.3%) as having subclinical left ventricular systolic dysfunction as assessed by global longitudinal myocardial strain parameters.
ConclusionsIn this group of hypertensive patients, global myocardial strain parameters identified a group of individuals with subclinical left ventricular systolic dysfunction despite preserved ejection fraction. The clinical relevance of these findings needs to be assessed in long-term follow-up studies.
O espectro da cardiopatia hipertensiva é diverso podendo ir até à disfunção ventricular esquerda. O desenvolvimento de metodologias ecocardiográficas que permitam melhorar o estadiamento da cardiopatia hipertensiva e identificar precocemente hipertensos em risco de evolução desfavorável poderá ser clinicamente relevante.
ObjetivosIdentificar o compromisso subclínico da função ventricular esquerda em indivíduos hipertensos com fração de ejeção preservada (> 55%), utilizando parâmetros globais da deformação miocárdica (Speckle Tracking).
MetodologiaForam estudados dois grupos de indivíduos: normotensos (N = 20; 59 ± 7 anos; 55% homens) e hipertensos (N = 229; 62 ± 12 anos; 57% homens), tendo sido avaliados vários parâmetros clínicos e ecocardiográficos de função ventricular esquerda (convencionais e parâmetros globais da deformação miocárdica longitudinal e circunferencial). Foram determinados os cut-offs da normalidade a partir do grupo de normotensos e aplicados ao grupo de hipertensos, para se detetar disfunção ventricular esquerda subclínica. Foram utilizados os testes t de Student, Mann-Whitney e do Qui-Quadrado.
ResultadosO grupo de hipertensos apresentou na sua maioria hipertensão arterial do tipo I (53,7%), pressão arterial controlada (64,9%) e alteração estrutural do ventrículo esquerdo em 54,8% dos indivíduos. Não se detetaram diferenças significativas entre os grupos nos parâmetros globais de deformação longitudinal ou circunferencial. Após aplicação dos cut-offs da normalidade nos hipertensos, foram identificados 35 indivíduos (15,3%) com disfunção ventricular esquerda subclínica.
ConclusõesA avaliação da deformação miocárdica permitiu identificar o compromisso sistólico subclínico da função ventricular esquerda num grupo de hipertensos com fração de ejeção preservada. A relevância clínica destes achados deverá ser confirmada por estudos de follow up prolongado.
global circumferential systolic strain
global circumferential late diastolic strain rate
global circumferential early diastolic strain rate
global circumferential systolic strain rate
global longitudinal strain
global longitudinal late diastolic strain rate
global longitudinal early diastolic strain rate
global longitudinal systolic strain rate
hypertension
left ventricular
odds ratio
Hypertension (HTN) is the leading risk factor for cardiovascular disease, and the third most important cause of morbidity, making early diagnosis and risk stratification crucial.1,2 Echocardiography is essential for assessment of the cardiac repercussions of HTN, particularly for early detection of left ventricular (LV) dysfunction, which is common in hypertensives.3
Conventional echocardiographic evaluation of hypertensive patients focuses on three key aspects: (1) degree of hypertrophy; (2) severity of diastolic dysfunction; and (3) global systolic function. This approach is closely linked to the idea that there is a continuum of cardiac expression in HTN and that LV systolic dysfunction develops late in its natural history.3–5 Advances in echocardiography over the last ten years have provided new methods of analysis that challenge this model, particularly analysis of myocardial strain by speckle tracking, which enables quantitative assessment of LV function with a high level of diagnostic accuracy.6,7 This technique can be used to study myocardial strain in all its dimensions – longitudinal, circumferential, transversal and radial – and twist. Strain analysis may detect subclinical cardiac involvement in hypertensives and thus identify asymptomatic patients at higher risk of developing adverse changes.1,8–10
The aim of the present study was to use sensitive echocardiographic methods to assess LV function in a population of hypertensives with preserved ejection fraction in order to detect early changes and thus identify those at increased risk.
MethodsWe performed a cross-sectional observational study of 229 hypertensives aged ≥35 years, with LV ejection fraction >55% as determined echocardiographically by Simpson's biplane method. Exclusion criteria were: (1) secondary hypertension; (2) diabetes; (3) associated cardiomyopathy; (4) moderate or severe valve disease; (5) chronic renal failure; (6) evidence of active coronary artery disease; and (7) non-sinus rhythm, including atrial fibrillation or pacemaker rhythm. All participants had been followed in outpatient cardiology consultations for at least 12 months. Recruitment for the study took place between January 2008 and January 2011.
A group of healthy normotensive individuals aged >35 years were also analyzed, and underwent clinical and laboratory assessment, exercise testing and 24-hour ambulatory blood pressure monitoring (ABPM).
Clinical assessmentDemographic (gender and age), anthropometric (weight and height) and clinical variables (concomitant risk factors and duration and control of HTN) were recorded, as was current medication.
HTN severity was assessed in accordance with European Society of Hypertension and European Society of Cardiology guidelines11,12 at the first follow-up consultation and on assessment for enrollment in the study. At the first follow-up assessment, mean blood pressure (BP) values on 24-hour ABPM were recorded (n=109), or when these data were unavailable, the highest BP values measured in the first two consecutive consultations (n=110); BP values at the time of assessment for enrollment in the study were also recorded. Brachial BP was measured by sphygmomanometer after a 5-min rest period in a seated position and the mean of two consecutive readings was included in the analysis.
Echocardiographic assessmentThe echocardiographic exams were performed on a Vivid 7 scanner (M4S 1.75–3.5 MHz probe, GE® Medical Systems), and included conventional study, tissue Doppler and analysis of myocardial strain by speckle tracking.
In all exams, cine loops of three cardiac cycles were acquired in two-dimensional mode in left parasternal short-axis (mitral valve, papillary muscles and apex) and apical 4-, 3- and 2-chamber views at a frame rate of >60/s, and stored for subsequent off-line analysis of myocardial strain. The conventional study was performed in accordance with the recommendations of the American Society of Echocardiography and European Association of Echocardiography,13,14 and measurements were indexed to body surface area when appropriate. The mean of three measurements was used in the analysis. Ejection fraction and LV end-diastolic and end-systolic volumes were calculated using Simpson's biplane method.
Assessment of LV geometry was based on LV mass (calculated as 0.8×[LV internal diameter at end-diastole+posterior wall thickness at end-diastole+septal wall thickness at end-diastole]3+0.6 g, indexed to body surface area and gender) and relative wall thickness (calculated as 2×posterior wall thickness at end-diastole/LV internal diameter at end-diastole), and classified as one of four patterns – normal, concentric remodeling, concentric hypertrophy or eccentric hypertrophy – in accordance with the guidelines.13
Diastolic function was characterized by pulsed Doppler study of transmitral flow (assessing peak early filling [E-wave] and late diastolic filling [A-wave] velocities and deceleration time of early filling velocity), pulsed tissue Doppler measurement of early diastolic velocity (E’) at the septal and lateral mitral annulus (determining mean E’ [septal+lateral/2] and mean E/E’ ratio), and assessment of left atrial (LA) end-systolic volume.14–16
The four categories of diastolic function considered were: (1) normal diastolic function, defined as septal E’ ≥8, lateral E’ ≥10 and LA volume <34 l/m2; (2) grade I diastolic dysfunction, defined as septal E’ <8, lateral E’ <10, LA volume ≥34 l/m2, E/A <0.8, deceleration time >200 ms, and mean E/E’ ≤8; (3) grade II diastolic dysfunction, defined as septal E’ <8, lateral E’ <10, LA volume ≥34 l/m2, E/A 0.8–1.5, deceleration time 160–200 ms and mean E/E’ 9–12; and (4) grade III diastolic dysfunction, defined as septal E’ <8, lateral E’ <10, LA volume ≥34 l/m2, E/A ≥2, deceleration time <160 ms and mean E/E’ ≥13.14
Two-dimensional strain imaging by speckle-trackingMyocardial strain parameters were assessed by blinded off-line speckle tracking analysis on a GE® EchoPAC workstation. A semi-automatic myocardial tracking system was used, with manual demarcation of the endocardial border in end-systole and manual adjustment of the region of interest. Only myocardial segments considered to be of adequate quality by both the automatic system and the operator were included in the analysis.
Global longitudinal myocardial strain was assessed based on analysis of apical views. Systolic function was assessed by measurement of global longitudinal peak systolic strain (GLS [%]) and global longitudinal peak systolic strain rate (GLSR-s [s−1]). Diastolic function was assessed by measurement of global longitudinal peak early diastolic strain rate (GLSR-e [s−1]) and global longitudinal late diastolic strain rate (GLSR-a [s−1]).
Circumferential myocardial strain was assessed based on analysis of short-axis views. Global systolic function was assessed by measurement of global circumferential peak systolic strain (GCS [%]) and global circumferential peak systolic strain rate (GCSR-s [s−1]). Diastolic function was assessed by measurement of global circumferential peak early diastolic strain rate (GCSR-e [s−1]) and global circumferential peak late diastolic strain rate (GCSR-a [s−1]).
Statistical analysisA descriptive statistical analysis was performed, and results presented in tables of absolute and relative frequencies. For quantitative variables measures of central location (mean and median) and of dispersion (standard deviation and interquartile range) were calculated. The Student's t test was used to compare the means of continuous variables with a normal distribution, and the Mann-Whitney nonparametric test was used to compare the medians of those with non-normal distribution. The chi-square test was used to compare percentages of qualitative variables. Odds ratios (OR) were calculated with a 95% confidence interval (CI).
In analysis of global myocardial strain parameters, cut-offs for normality were established based on the limit values of longitudinal and circumferential systolic myocardial strain parameters in the group of normotensives. The cut-off for LV systolic dysfunction was the upper limit (mean + 2 standard deviations) for longitudinal and circumferential strain parameters: GLS (%) and GLSR-s (s−1), and GCS (%) and GCSR-s (s−1), respectively; the closer negative values are to the baseline (zero), the greater the LV dysfunction. The degree of concordance was assessed using the kappa coefficient.
SPSS version 19 was used for the statistical analysis, using a level of significance of 5%.
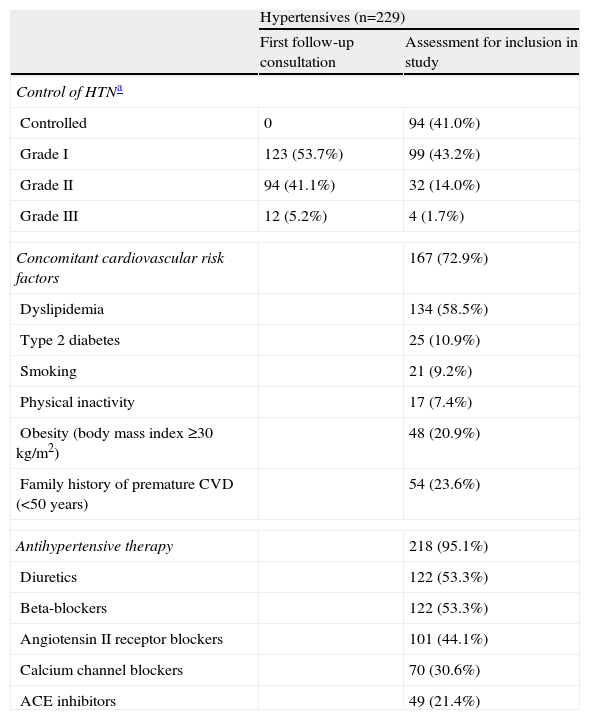
ResultsPopulation characteristicsThe study included 229 hypertensive individuals (mean age 62±12 years, 53.7% male) with preserved ejection fraction, 68.1% of whom had been diagnosed with HTN more than five years previously. None were in New York Heart Association functional class ≥II. The demographic and clinical characteristics of the population are shown in Table 1.
Characterization of the hypertensive population.
| Hypertensives (n=229) | ||
| First follow-up consultation | Assessment for inclusion in study | |
| Control of HTNa | ||
| Controlled | 0 | 94 (41.0%) |
| Grade I | 123 (53.7%) | 99 (43.2%) |
| Grade II | 94 (41.1%) | 32 (14.0%) |
| Grade III | 12 (5.2%) | 4 (1.7%) |
| Concomitant cardiovascular risk factors | 167 (72.9%) | |
| Dyslipidemia | 134 (58.5%) | |
| Type 2 diabetes | 25 (10.9%) | |
| Smoking | 21 (9.2%) | |
| Physical inactivity | 17 (7.4%) | |
| Obesity (body mass index ≥30 kg/m2) | 48 (20.9%) | |
| Family history of premature CVD (<50 years) | 54 (23.6%) | |
| Antihypertensive therapy | 218 (95.1%) | |
| Diuretics | 122 (53.3%) | |
| Beta-blockers | 122 (53.3%) | |
| Angiotensin II receptor blockers | 101 (44.1%) | |
| Calcium channel blockers | 70 (30.6%) | |
| ACE inhibitors | 49 (21.4%) | |
The severity of hypertension was classified according to the guidelines of the European Society of Hypertension and European Society of Cardiology: for office blood pressure measurements: grade I: 140–159 mmHg/90–99 mmHg; grade II: 160–179 mmHg/100–109 mmHg; grade III: ≥180 mmHg/110 mmHg; for 24-hour ambulatory blood pressure monitoring: grade I: 131–149 mmHg/80–89 mmHg; grade II: 150–169 mmHg/90–99 mmHg; grade III: ≥170 mmHg/100 mmHg (mean 24-hour values). ACE: angiotensin-converting enzyme; CVD: cardiovascular disease; HTN: hypertension.
To determine the limits of normality for global myocardial strain parameters, 20 healthy normotensive individuals were studied, with no significant differences in gender (55% male) or age distribution (mean age 59±7 years) from the hypertensive study population.
Conventional echocardiographyIn the hypertensive group, 45.8% presented normal LV geometry, 9.7% concentric remodeling, 22.0% concentric hypertrophy and 22.5% eccentric hypertrophy; they also had greater LV mass (107±29 g/m2 vs. 74±13 g/m2, p<0.001) and relative wall thickness (0.40±0.07 vs. 0.31±0.04, p<0.001) than the normotensive group.
Alterations in diastolic function were detected in 52.4% (n=120), with grade I dysfunction in 30.1% (n=69) and grade II in 22.3% (n=51). None presented grade III dysfunction.
Global myocardial strain by speckle trackingThe quality of the cine loops acquired in two-dimensional mode was sufficient in all 229 hypertensive subjects to assess longitudinal myocardial strain and in 103 to assess circumferential strain.
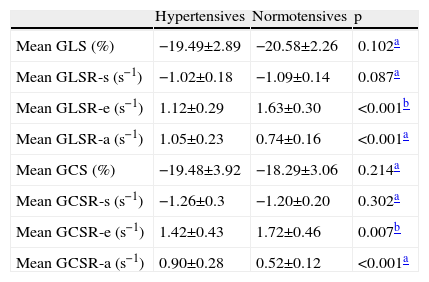
The global longitudinal and circumferential myocardial strain parameters that reflect LV systolic function (GLS, GLSR-s, GCS and GCSR-s) showed no significant differences between the two groups. However, global diastolic strain parameters, both longitudinal (GLSR-e and GLSR-a) and circumferential (GCSR-e and GCSR-a), were significantly altered in the hypertensive group (Table 2).
Mean longitudinal (4-+3-+2-chamber/3) and circumferential (mitral valve+papillary muscles+apex/3) strain parameters in the two groups under study.
| Hypertensives | Normotensives | p | |
| Mean GLS (%) | −19.49±2.89 | −20.58±2.26 | 0.102a |
| Mean GLSR-s (s−1) | −1.02±0.18 | −1.09±0.14 | 0.087a |
| Mean GLSR-e (s−1) | 1.12±0.29 | 1.63±0.30 | <0.001b |
| Mean GLSR-a (s−1) | 1.05±0.23 | 0.74±0.16 | <0.001a |
| Mean GCS (%) | −19.48±3.92 | −18.29±3.06 | 0.214a |
| Mean GCSR-s (s−1) | −1.26±0.3 | −1.20±0.20 | 0.302a |
| Mean GCSR-e (s−1) | 1.42±0.43 | 1.72±0.46 | 0.007b |
| Mean GCSR-a (s−1) | 0.90±0.28 | 0.52±0.12 | <0.001a |
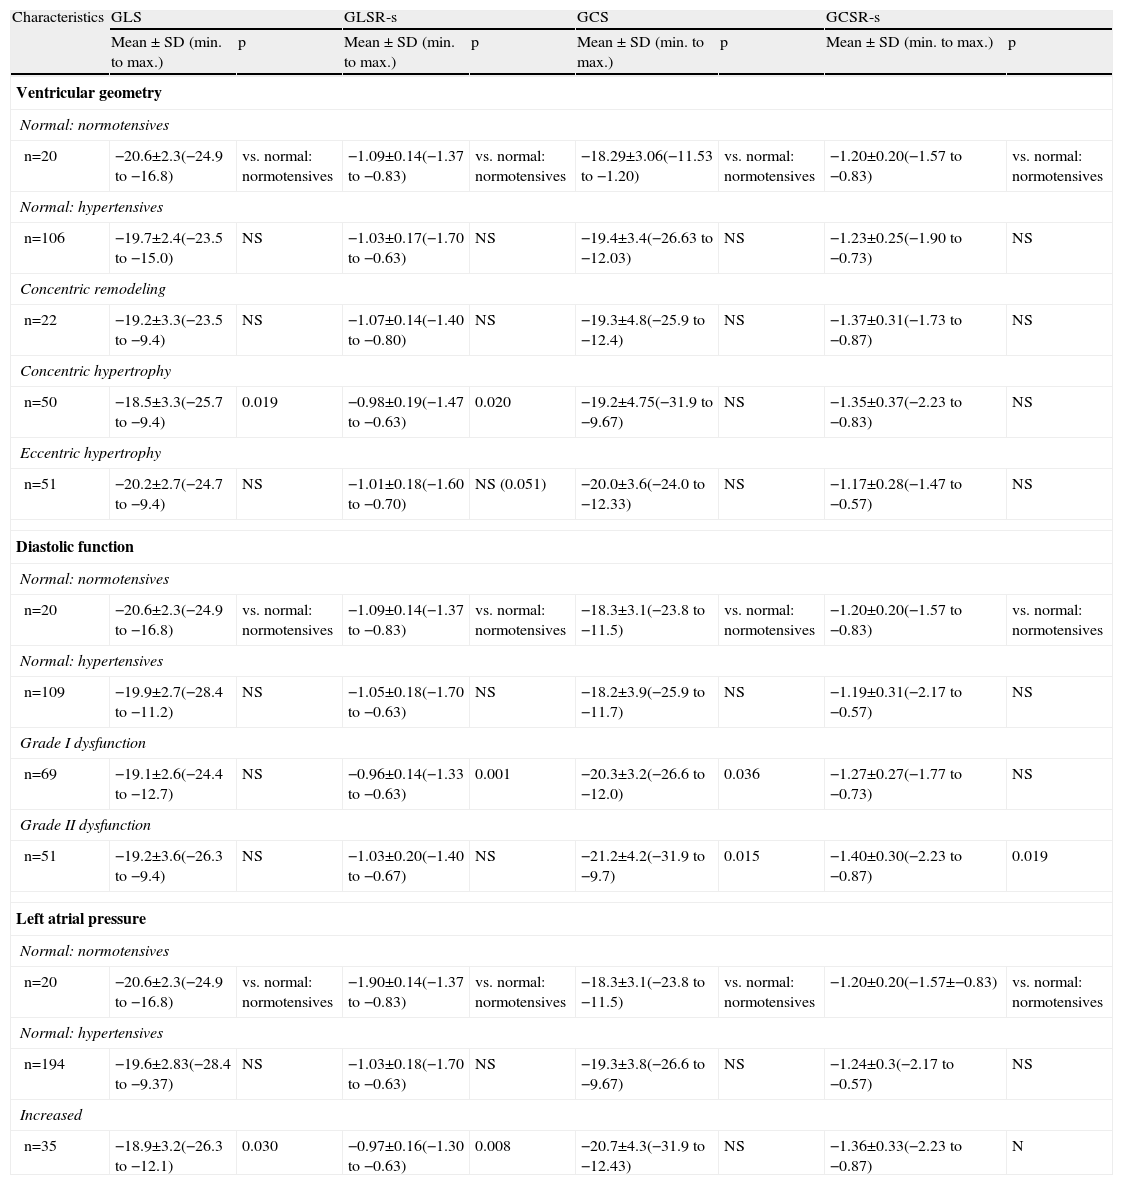
The distribution of global systolic myocardial strain parameters as a function of LV geometry and diastolic function and LA pressure is shown in Table 3.
Distribution of global myocardial strain parameters according to echocardiographic characteristics (ventricular geometry, diastolic function and left atrial pressure).
| Characteristics | GLS | GLSR-s | GCS | GCSR-s | ||||
| Mean ± SD (min. to max.) | p | Mean ± SD (min. to max.) | p | Mean ± SD (min. to max.) | p | Mean ± SD (min. to max.) | p | |
| Ventricular geometry | ||||||||
| Normal: normotensives | ||||||||
| n=20 | −20.6±2.3(−24.9 to −16.8) | vs. normal: normotensives | −1.09±0.14(−1.37 to −0.83) | vs. normal: normotensives | −18.29±3.06(−11.53 to −1.20) | vs. normal: normotensives | −1.20±0.20(−1.57 to −0.83) | vs. normal: normotensives |
| Normal: hypertensives | ||||||||
| n=106 | −19.7±2.4(−23.5 to −15.0) | NS | −1.03±0.17(−1.70 to −0.63) | NS | −19.4±3.4(−26.63 to −12.03) | NS | −1.23±0.25(−1.90 to −0.73) | NS |
| Concentric remodeling | ||||||||
| n=22 | −19.2±3.3(−23.5 to −9.4) | NS | −1.07±0.14(−1.40 to −0.80) | NS | −19.3±4.8(−25.9 to −12.4) | NS | −1.37±0.31(−1.73 to −0.87) | NS |
| Concentric hypertrophy | ||||||||
| n=50 | −18.5±3.3(−25.7 to −9.4) | 0.019 | −0.98±0.19(−1.47 to −0.63) | 0.020 | −19.2±4.75(−31.9 to −9.67) | NS | −1.35±0.37(−2.23 to −0.83) | NS |
| Eccentric hypertrophy | ||||||||
| n=51 | −20.2±2.7(−24.7 to −9.4) | NS | −1.01±0.18(−1.60 to −0.70) | NS (0.051) | −20.0±3.6(−24.0 to −12.33) | NS | −1.17±0.28(−1.47 to −0.57) | NS |
| Diastolic function | ||||||||
| Normal: normotensives | ||||||||
| n=20 | −20.6±2.3(−24.9 to −16.8) | vs. normal: normotensives | −1.09±0.14(−1.37 to −0.83) | vs. normal: normotensives | −18.3±3.1(−23.8 to −11.5) | vs. normal: normotensives | −1.20±0.20(−1.57 to −0.83) | vs. normal: normotensives |
| Normal: hypertensives | ||||||||
| n=109 | −19.9±2.7(−28.4 to −11.2) | NS | −1.05±0.18(−1.70 to −0.63) | NS | −18.2±3.9(−25.9 to −11.7) | NS | −1.19±0.31(−2.17 to −0.57) | NS |
| Grade I dysfunction | ||||||||
| n=69 | −19.1±2.6(−24.4 to −12.7) | NS | −0.96±0.14(−1.33 to −0.63) | 0.001 | −20.3±3.2(−26.6 to −12.0) | 0.036 | −1.27±0.27(−1.77 to −0.73) | NS |
| Grade II dysfunction | ||||||||
| n=51 | −19.2±3.6(−26.3 to −9.4) | NS | −1.03±0.20(−1.40 to −0.67) | NS | −21.2±4.2(−31.9 to −9.7) | 0.015 | −1.40±0.30(−2.23 to −0.87) | 0.019 |
| Left atrial pressure | ||||||||
| Normal: normotensives | ||||||||
| n=20 | −20.6±2.3(−24.9 to −16.8) | vs. normal: normotensives | −1.90±0.14(−1.37 to −0.83) | vs. normal: normotensives | −18.3±3.1(−23.8 to −11.5) | vs. normal: normotensives | −1.20±0.20(−1.57±−0.83) | vs. normal: normotensives |
| Normal: hypertensives | ||||||||
| n=194 | −19.6±2.83(−28.4 to −9.37) | NS | −1.03±0.18(−1.70 to −0.63) | NS | −19.3±3.8(−26.6 to −9.67) | NS | −1.24±0.3(−2.17 to −0.57) | NS |
| Increased | ||||||||
| n=35 | −18.9±3.2(−26.3 to −12.1) | 0.030 | −0.97±0.16(−1.30 to −0.63) | 0.008 | −20.7±4.3(−31.9 to −12.43) | NS | −1.36±0.33(−2.23 to −0.87) | N |
Abbreviations as in text.
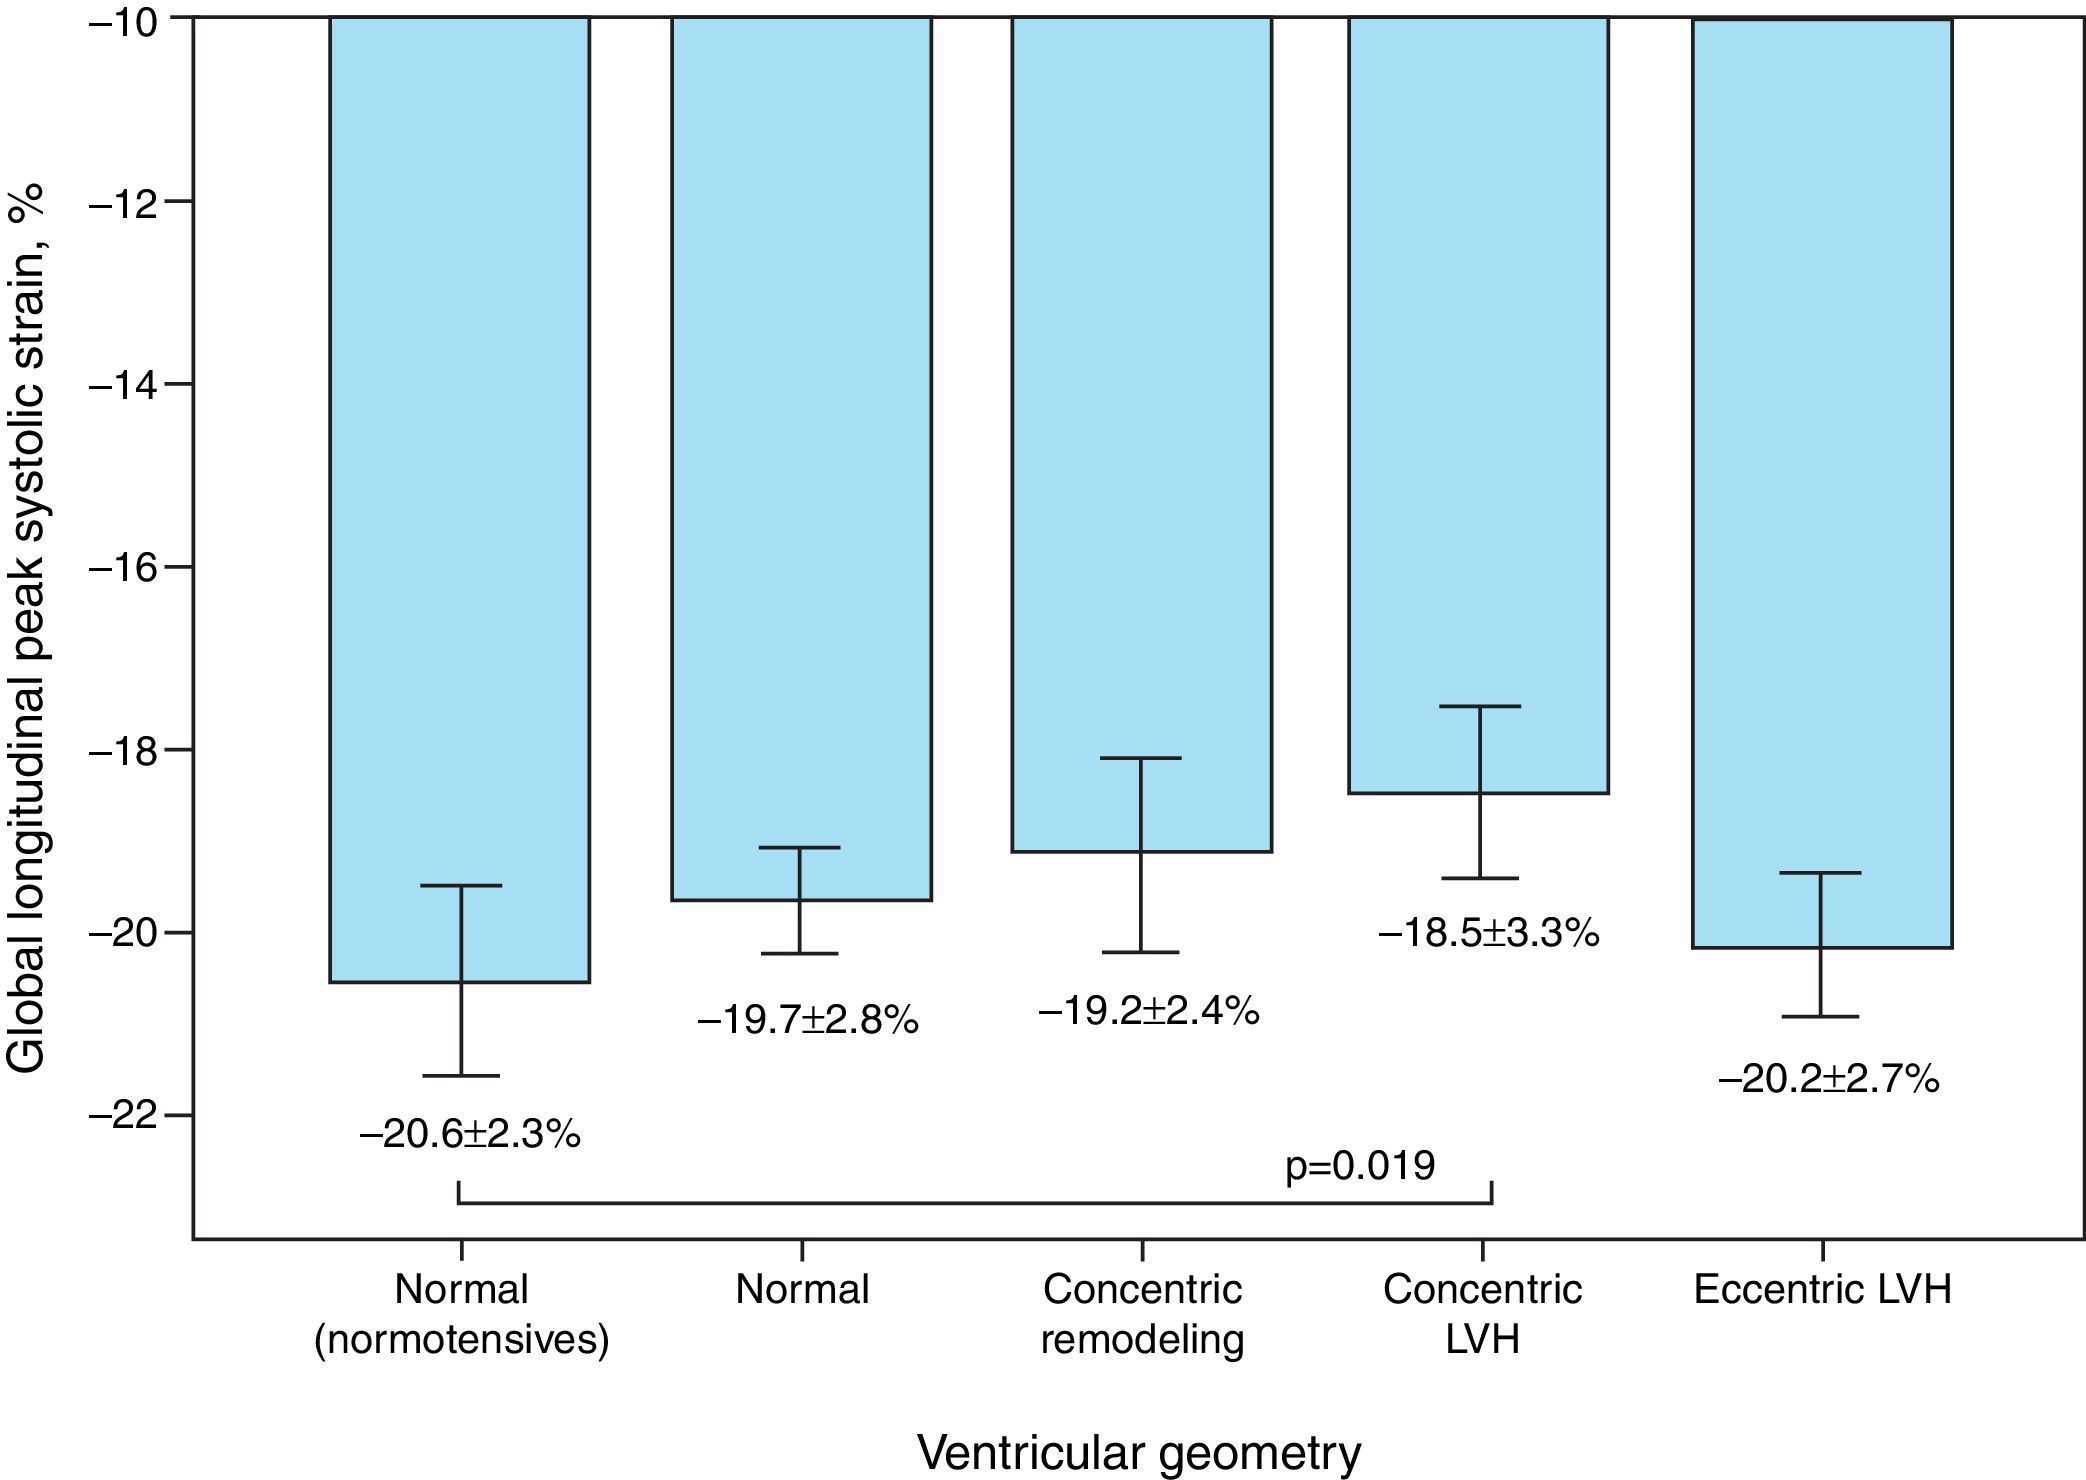
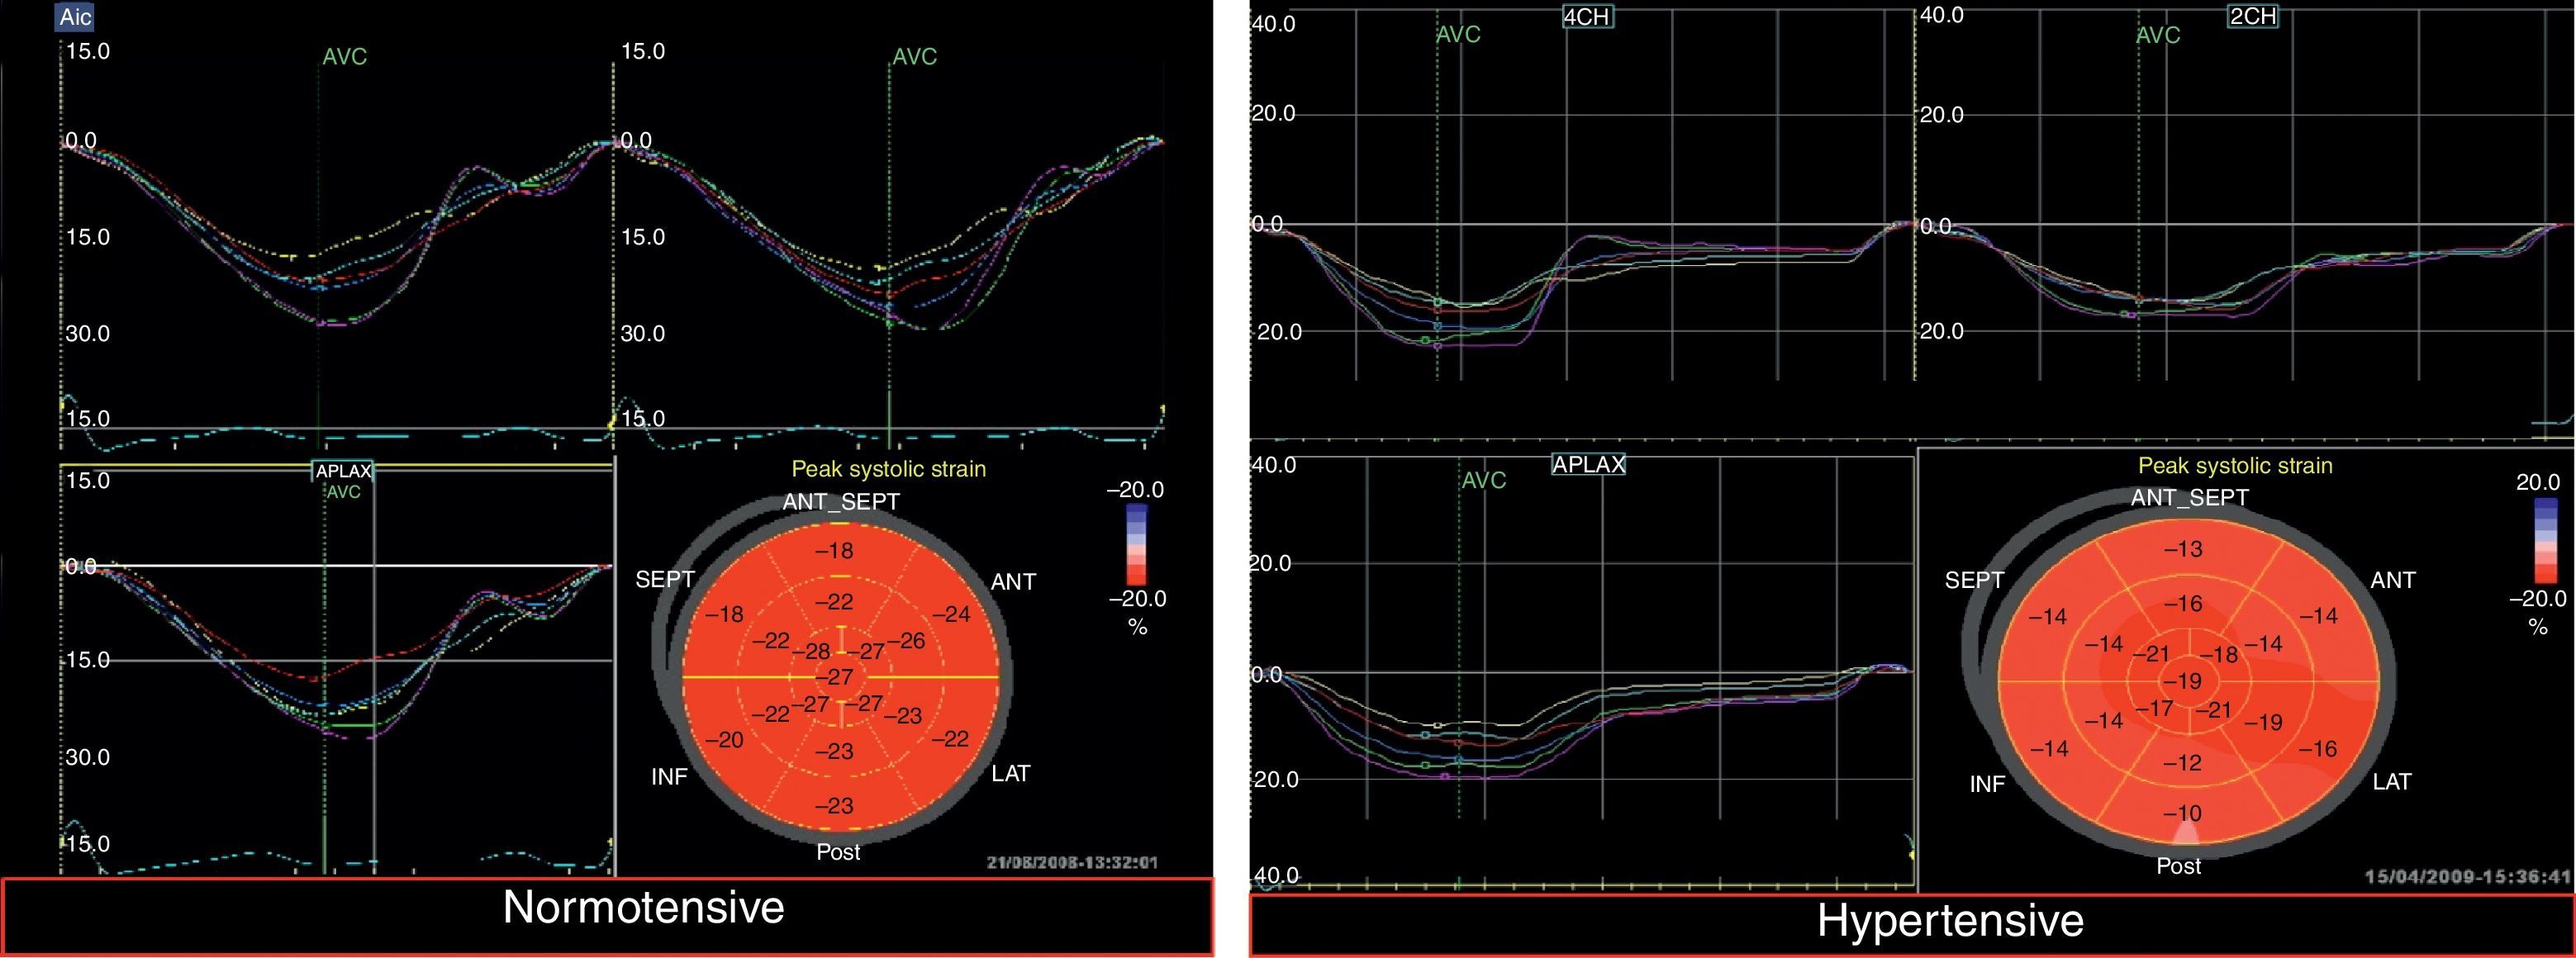
Mean GLS and GLSR-s in hypertensive individuals were −19.5±2.9% and −1.02±0.18 s−1, respectively. GLS varied significantly according to the presence of altered LV geometry, particularly reduced longitudinal systolic strain in those with concentric LV hypertrophy (p=0.019) (Figure 1). Furthermore, longitudinal systolic strain parameters were significantly reduced in individuals with increased LA pressure, but showed no correlation with severity of diastolic dysfunction.
 in normotensives and hypertensives. LVH: left ventricular hypertrophy.")
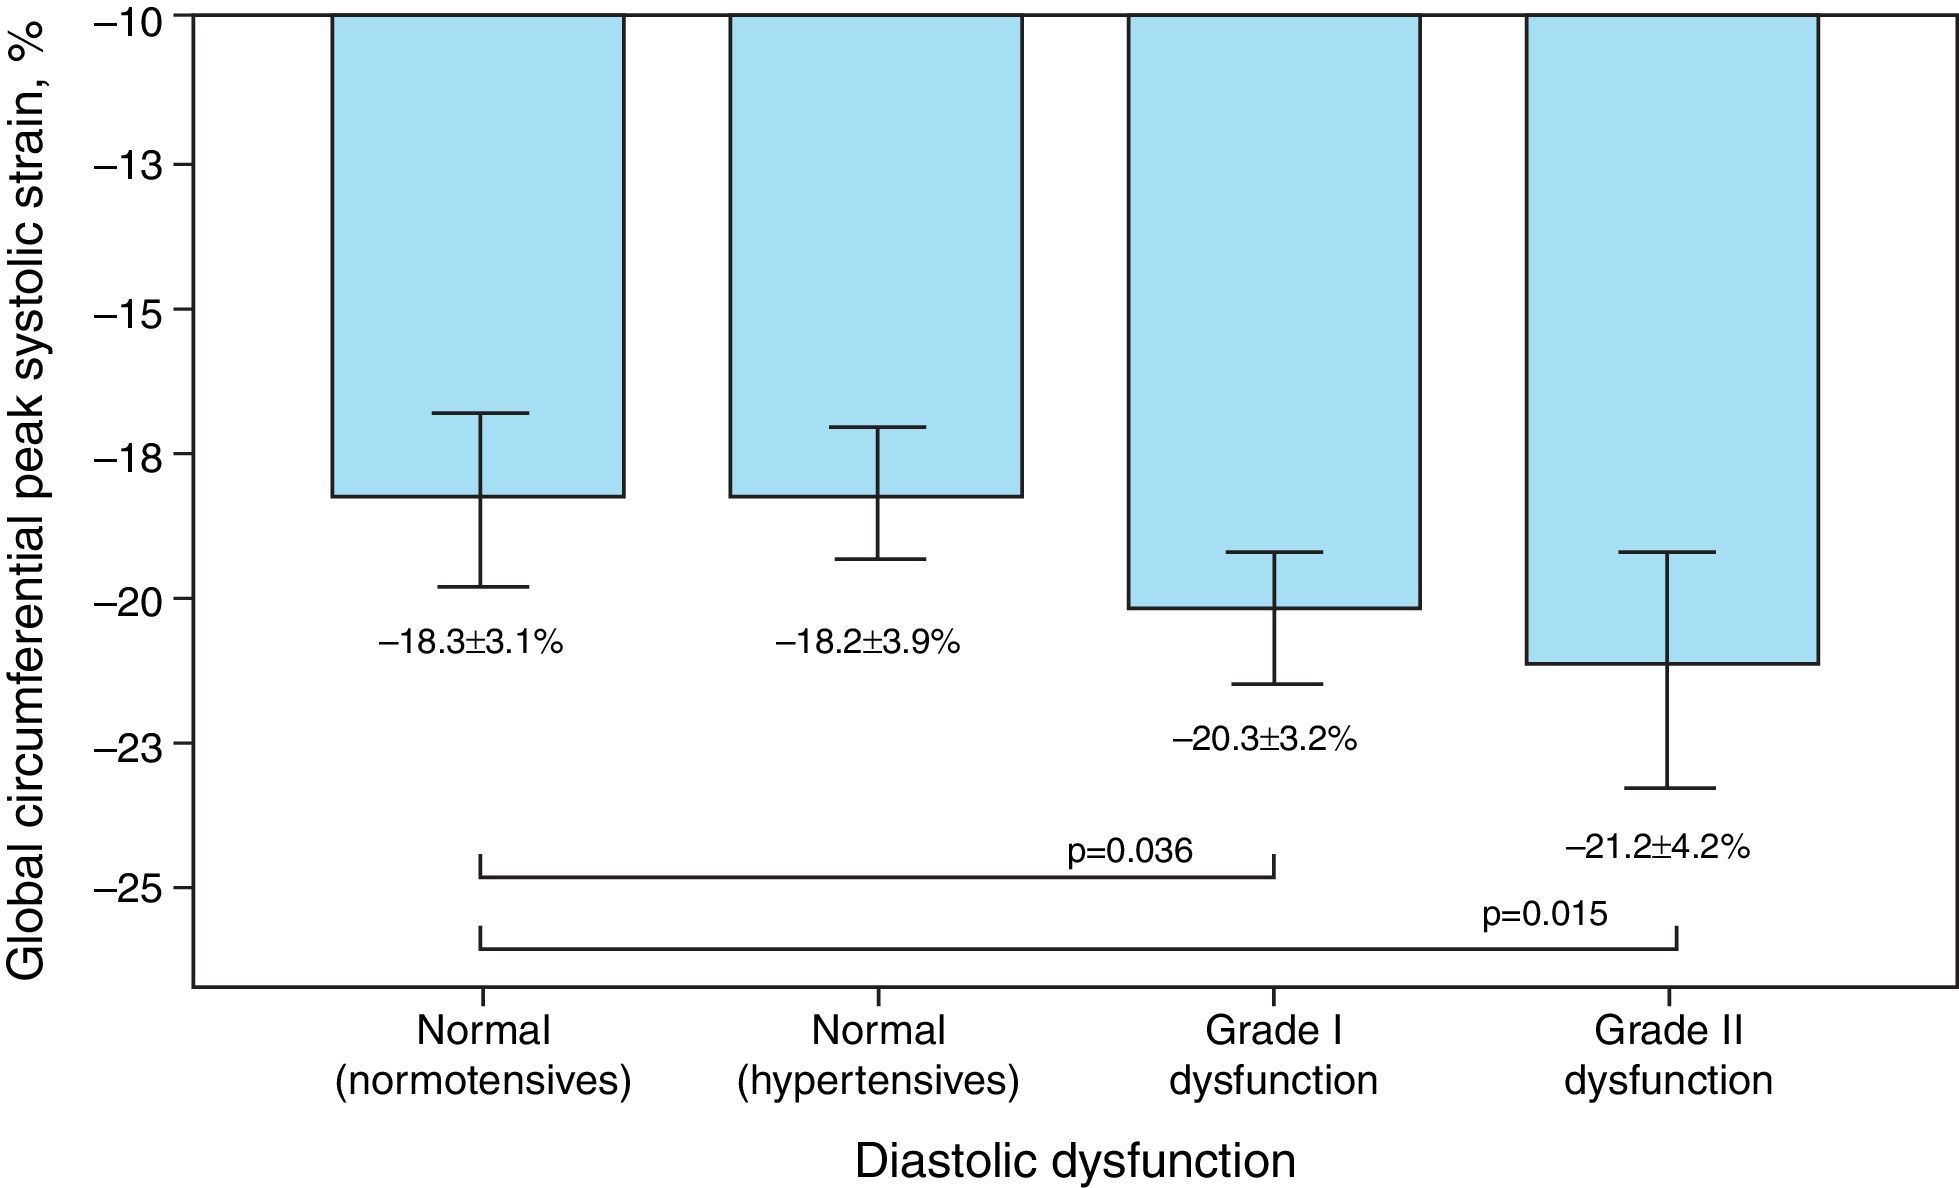
Mean GCS and GCSR-s in hypertensive individuals were −19.5±3.9% and −1.26±0.3 s−1, respectively, and differed significantly according to the presence of diastolic dysfunction, although paradoxically they were more negative in those with more severe dysfunction (Figure 2).
 in normotensives and hypertensives.")
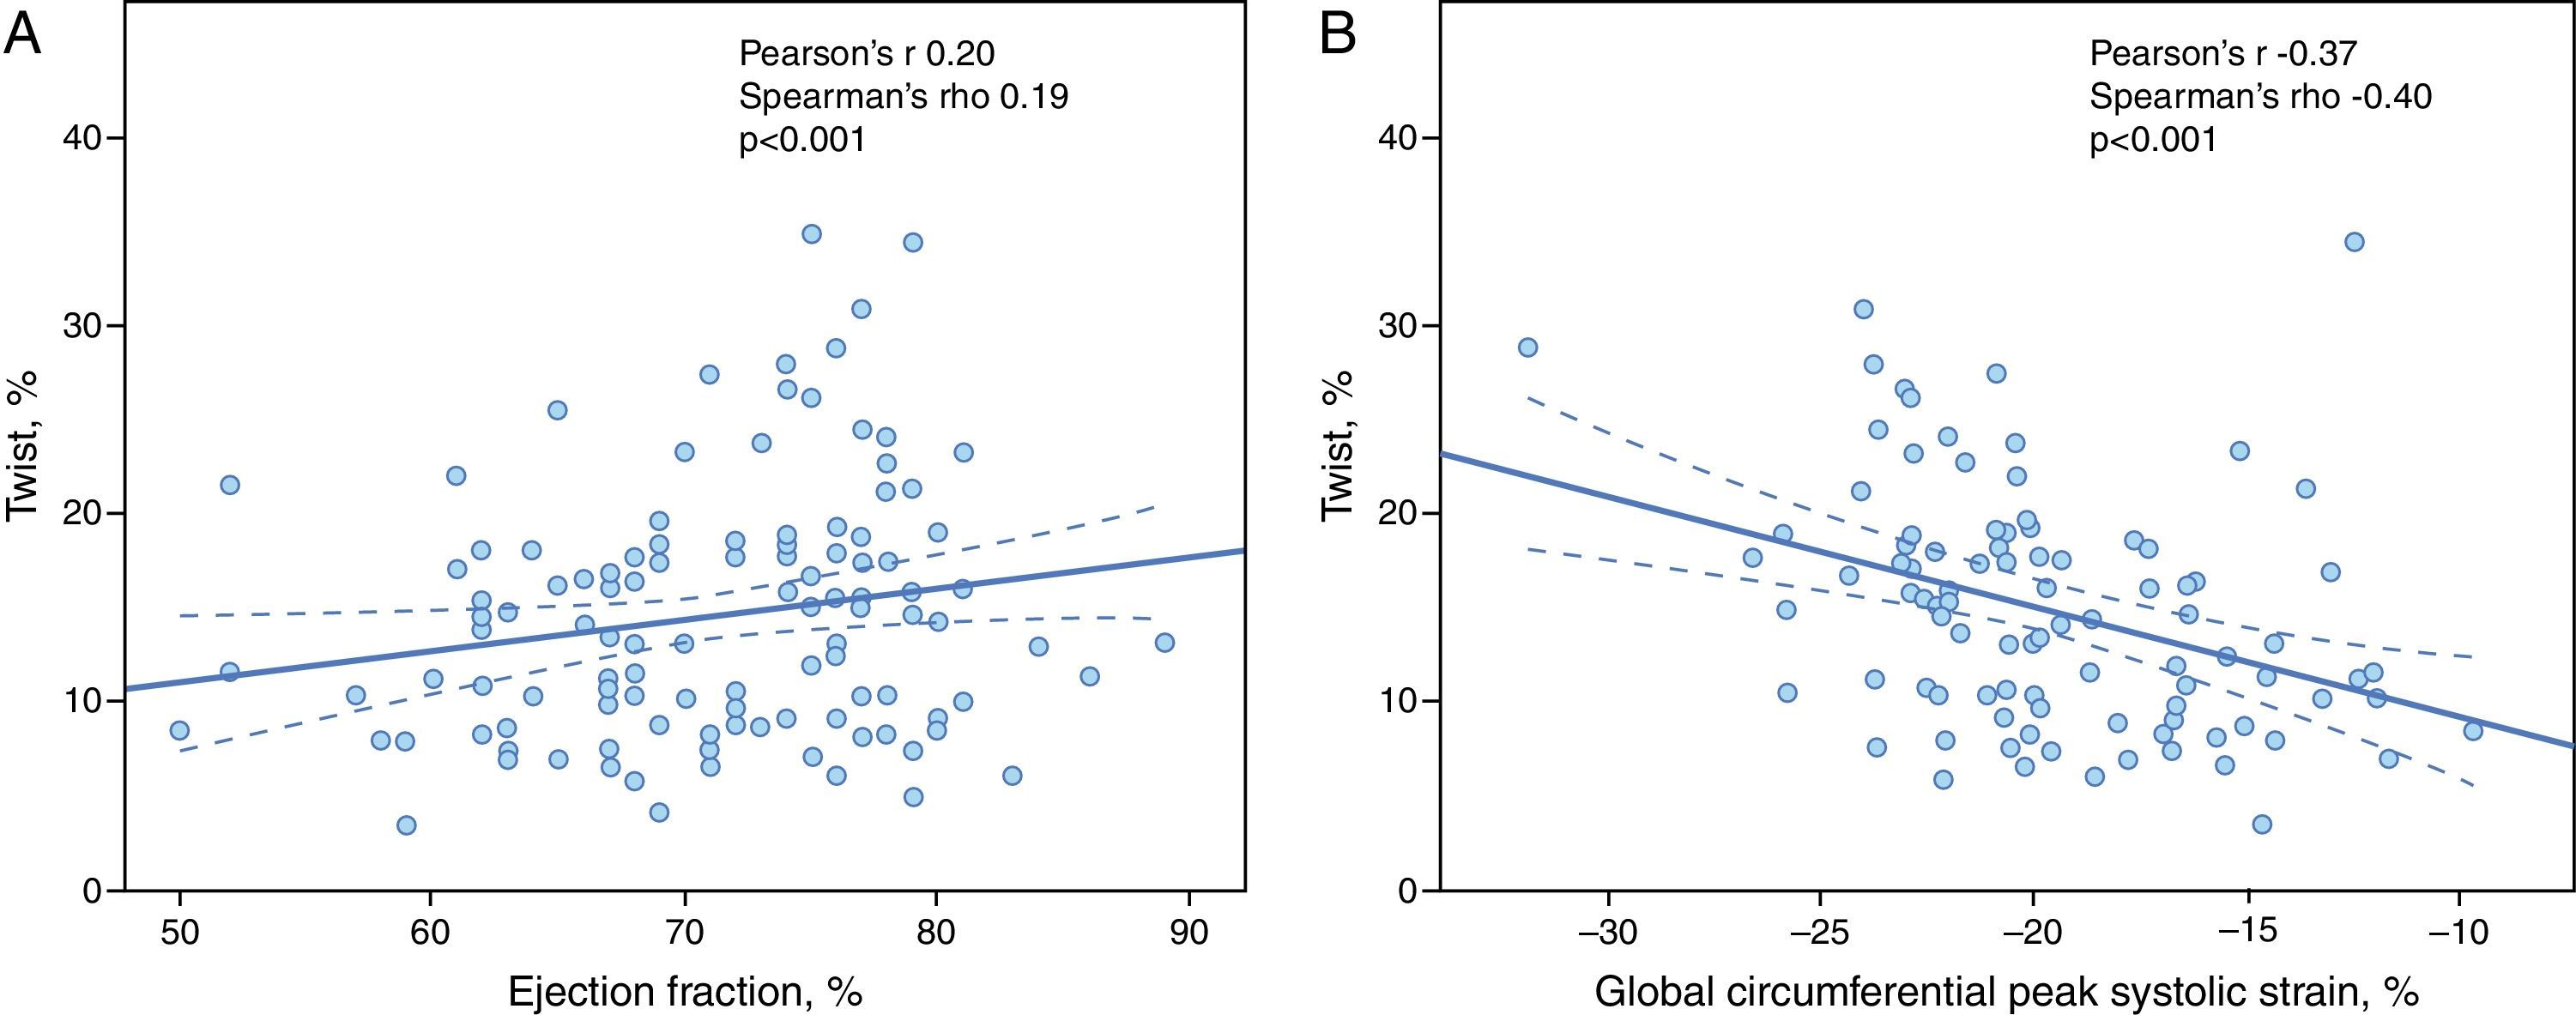
Twist was assessed in 95 hypertensives, with a mean value of 14±6°; it did not vary according to the degree of HTN, changes in LV geometry or diastolic dysfunction. There was however a significant correlation with GCS (Pearson's r −0.37, p<0.001; Spearman's rho −0.40, p<0.0019) and with GCSR-s (Pearson's r −0.28, p=0.003; Spearman's rho −0.30, p=0.001). In addition, twist showed a weak positive correlation with LV ejection fraction (Pearson's r 0.20, p=0.021; Spearman's rho 0.19, p=0.028) (Figure 3).

Myocardial strain parameters showed a normal distribution in the normotensive group and thus limits of normality could be established (−16.50% and −0.82 s−1 for GLS and GLSR-s, respectively). Applying these cut-offs in the hypertensive group revealed impaired longitudinal myocardial strain in 15.3% (n=35).
The limits of normality for GCS and GCSR-s were −12.17% and −0.81 s−1, respectively; applying these cut-offs in the hypertensive group revealed impaired circumferential myocardial strain in 4% (n=9).
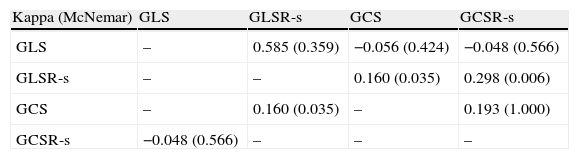
The degree of concordance for detection of subclinical LV systolic dysfunction as assessed by the various parameters of myocardial strain was weak to moderate (Table 4).
Degree of concordance between GLS, GLSR-s, GCS and GCSR-s for detection of left ventricular dysfunction as assessed by the kappa coefficient.
| Kappa (McNemar) | GLS | GLSR-s | GCS | GCSR-s |
| GLS | – | 0.585 (0.359) | −0.056 (0.424) | −0.048 (0.566) |
| GLSR-s | – | – | 0.160 (0.035) | 0.298 (0.006) |
| GCS | – | 0.160 (0.035) | – | 0.193 (1.000) |
| GCSR-s | −0.048 (0.566) | – | – | – |
Abbreviations as in text.
Given that analysis of circumferential strain was only possible in a small group of individuals, and that the degree of concordance between these parameters for assessing subclinical systolic dysfunction was lower, myocardial strain was assessed based on longitudinal parameters only. Subclinical global systolic dysfunction was thus considered present when GLS was below the cut-off of −16.50% or GLSR-s was below −0.82 s−1.
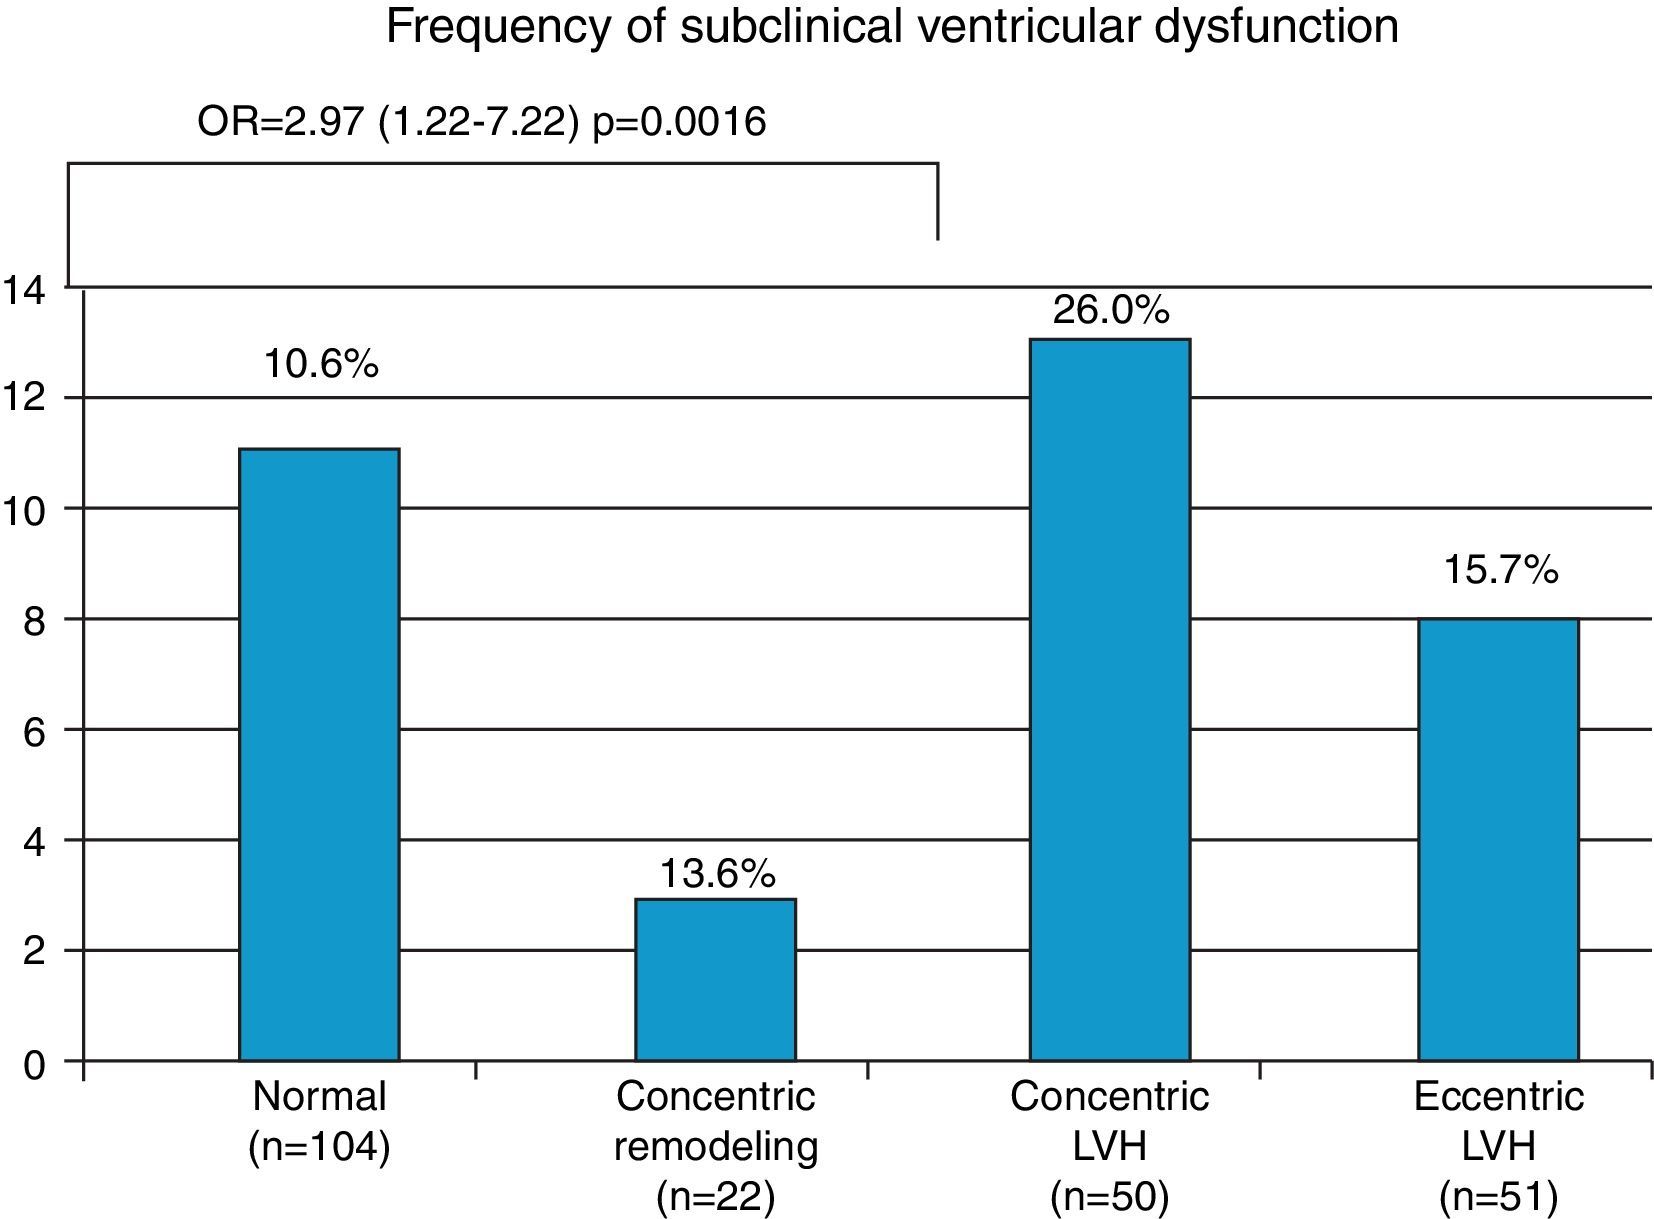
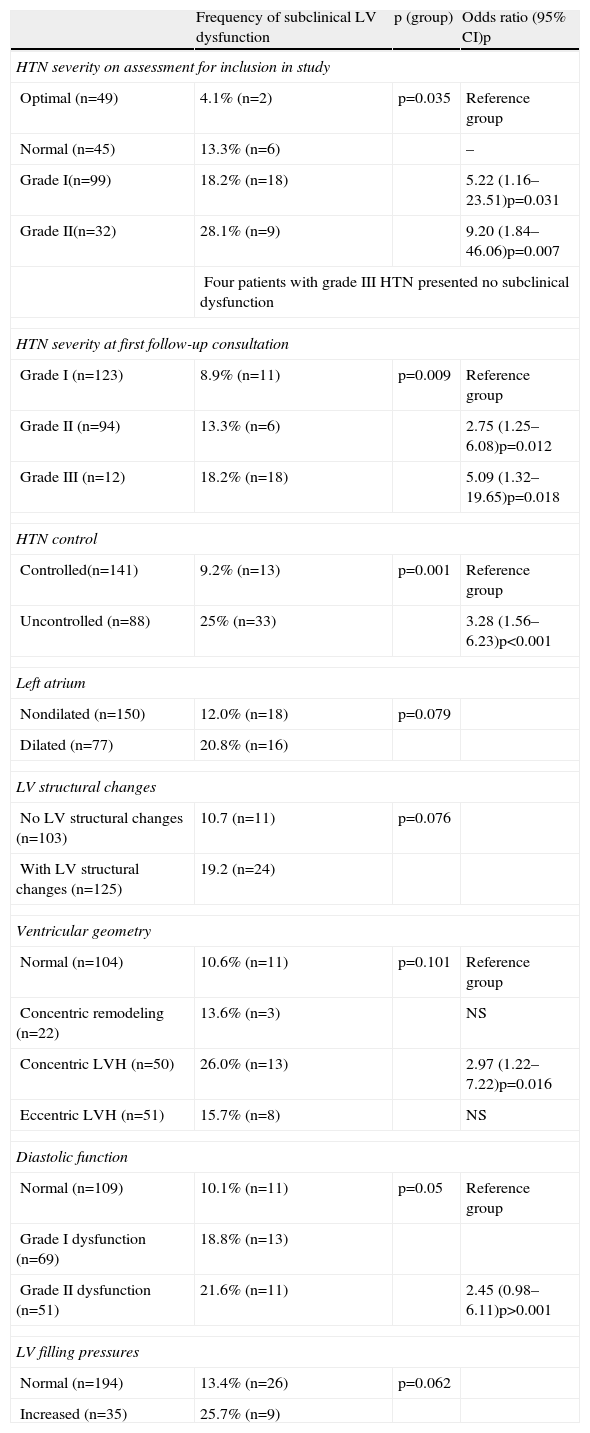
Hypertensives with subclinical LV dysfunction presented more severe HTN, most of them with uncontrolled BP and LV structural changes; the likelihood of dysfunction was three times greater in those with concentric LV hypertrophy (OR 2.97, 95% CI 1.22–7.22, p=0.016) (Figure 4). Those with subclinical LV dysfunction also presented more severe diastolic dysfunction and increased filling pressures (Table 5).

Distribution of subclinical left ventricular dysfunction according to clinical (severity and control of hypertension) and echocardiographic characteristics (left atrial size, left ventricular structural changes, ventricular geometry, diastolic function and left atrial pressure).
| Frequency of subclinical LV dysfunction | p (group) | Odds ratio (95% CI)p | |
| HTN severity on assessment for inclusion in study | |||
| Optimal (n=49) | 4.1% (n=2) | p=0.035 | Reference group |
| Normal (n=45) | 13.3% (n=6) | – | |
| Grade I(n=99) | 18.2% (n=18) | 5.22 (1.16–23.51)p=0.031 | |
| Grade II(n=32) | 28.1% (n=9) | 9.20 (1.84–46.06)p=0.007 | |
| Four patients with grade III HTN presented no subclinical dysfunction | |||
| HTN severity at first follow-up consultation | |||
| Grade I (n=123) | 8.9% (n=11) | p=0.009 | Reference group |
| Grade II (n=94) | 13.3% (n=6) | 2.75 (1.25–6.08)p=0.012 | |
| Grade III (n=12) | 18.2% (n=18) | 5.09 (1.32–19.65)p=0.018 | |
| HTN control | |||
| Controlled(n=141) | 9.2% (n=13) | p=0.001 | Reference group |
| Uncontrolled (n=88) | 25% (n=33) | 3.28 (1.56–6.23)p<0.001 | |
| Left atrium | |||
| Nondilated (n=150) | 12.0% (n=18) | p=0.079 | |
| Dilated (n=77) | 20.8% (n=16) | ||
| LV structural changes | |||
| No LV structural changes (n=103) | 10.7 (n=11) | p=0.076 | |
| With LV structural changes (n=125) | 19.2 (n=24) | ||
| Ventricular geometry | |||
| Normal (n=104) | 10.6% (n=11) | p=0.101 | Reference group |
| Concentric remodeling (n=22) | 13.6% (n=3) | NS | |
| Concentric LVH (n=50) | 26.0% (n=13) | 2.97 (1.22–7.22)p=0.016 | |
| Eccentric LVH (n=51) | 15.7% (n=8) | NS | |
| Diastolic function | |||
| Normal (n=109) | 10.1% (n=11) | p=0.05 | Reference group |
| Grade I dysfunction (n=69) | 18.8% (n=13) | ||
| Grade II dysfunction (n=51) | 21.6% (n=11) | 2.45 (0.98–6.11)p>0.001 | |
| LV filling pressures | |||
| Normal (n=194) | 13.4% (n=26) | p=0.062 | |
| Increased (n=35) | 25.7% (n=9) | ||
LVH: left ventricular hypertrophy. Other abbreviations as in text.
In the hypertensives with subclinical LV dysfunction, ORs were calculated according to the severity and control of HTN. Individuals with grade I (OR 5.22, 95% CI 1.16–23.51, p=0.031) or grade II HTN (OR 9.20, 95% CI 1.84–46.06, p=0.007) on assessment for enrollment in the study, as well as those with uncontrolled BP (OR 3.28, 95% CI 1.56–6.23, p<0.001), showed a greater likelihood of developing subclinical LV dysfunction (Table 5).
DiscussionThe principal objective of this study was to assess LV function in a group of hypertensive individuals with preserved ejection fraction, using conventional and speckle tracking echocardiography to assess global myocardial strain parameters that would identify subclinical LV dysfunction.
LV mass and relative wall thickness were significantly increased in the study population. Schillaci et al.4 demonstrated that there is a continuous relation between increased LV mass and cardiovascular risk in essential HTN, even in the absence of target organ damage.
On assessment of diastolic function14 52.4% of our population presented criteria of diastolic dysfunction, mainly grade I (30.1%). Various studies have suggested that complex interactions between cellular hyperplasia, cell death, fibrosis and reduced calcium uptake, together with increased myocardial stiffness, may be responsible for diastolic dysfunction in hypertensive individuals, while other authors argue that diastolic dysfunction may be an early marker of hypertensive heart disease.17,18
Global longitudinal and circumferential strain parameters that reflect LV systolic function, notably global peak systolic strain and strain rate, did not show significant differences between hypertensives and normotensives in our study, which may be explained by the fact that most of our population had grade I HTN (53.7%) and controlled BP (61.6%). These results are in agreement with previous studies, particularly Narayanan et al., who reported that individuals with mild HTN and preserved ejection fraction may not present significantly reduced strain parameters.19
Global longitudinal and circumferential peak early and late diastolic strain rates were significantly altered in the hypertensive group, which highlights the importance of assessing not only spatial but also temporal parameters through strain rates. Studies in larger and more diverse hypertensive populations may help clarify the reason for these differences. It may be the case that early changes in LV mechanics lead to a temporal redistribution of certain diastolic phenomena; this was in fact documented in hemodynamic terms through Doppler flow study, which may thus also reflect the mechanical changes identified by strain rates.
Different cut-off values for myocardial strain parameters were used in previous studies.20,21 It should be noted however that most of these studies were not performed in Mediterranean-type populations, and so we decided to establish cut-offs for LV dysfunction based on a group, albeit small, of normotensives, since these individuals were similar in terms of gender and age distribution to the hypertensive group and were representative of a Mediterranean-type population.
Applying these cut-offs revealed impaired myocardial longitudinal strain in 15.3% (n=35) of the 229 hypertensives assessed (Figure 5). Both GLS and GLSR-s showed moderate concordance (kappa coefficient 0.581) for detection of subclinical LV dysfunction. The parameters of circumferential strain, GCS and GCSR-s, detected few individuals with subclinical LV dysfunction (3.9%, n=4), and showed no concordance (kappa coefficient −0.107).
 and a hypertensive individual (right).")
The risk of subclinical LV dysfunction appeared to be associated with HTN severity and level of BP control, as well as with the presence of concentric LV hypertrophy. Some authors suggest that hypertrophy in hypertensive heart disease results from an adaptive response to increased afterload, followed by progressive myocardial fibrosis. According to Geyer et al., speckle tracking-derived longitudinal strain is reduced in hypertension, while circumferential and radial strain and torsional mechanics are preserved, although LV untwisting may be abnormal and delayed.9 Some authors report that LV twist may even be increased in hypertensives.22
The correlation between strain parameters and laboratory markers of myocardial fibrosis in patients with HTN has sparked some interest. Kang et al. studied hypertensives with normal ejection fraction and reported that they presented reduced GLS and a paradoxical increase in LV torsion. These findings correlated quantitatively with serum tissue inhibitor of matrix metalloproteinase-1, which is responsible for collagen fiber deposition in the myocardium. The authors also concluded that assessment of myocardial strain by speckle tracking in hypertensives can be useful for early detection of subclinical systolic dysfunction, which appears to be related to progressive myocardial fibrosis.23 In their study torsion was an early marker of systolic dysfunction, since this was shown to be altered long before irreversible tissue damage, and increased torsion was observed in the hypertensive group, particularly basal rotation. Increased rotation has also been associated with older age and changes in diastolic filling.24
Subendocardial fibers are the first to be affected by interstitial and perivascular fibrosis, and hence longitudinal fibers, mainly located subendocardially, are more vulnerable to fibrosis and hemodynamic overload. Longitudinal function is thus affected earlier than circumferential performance. Several studies recommend assessment of global longitudinal strain as an early marker of subclinical LV dysfunction.25–27
LimitationsOne limitation of the study is the fact that measurements were not directly validated by cardiac magnetic resonance imaging (MRI). However, Amundsen et al.28 demonstrated a good correlation between speckle tracking echocardiography and MRI.
A second limitation is that the cut-offs used were established on the basis of a small sample of normotensives, but this method was chosen in order to match the characteristics of the hypertensive group in terms of age, gender and ethnicity.
The fact that HTN had been medicated and controlled for a long period means that the study population may not be truly representative of the whole spectrum of hypertensive heart disease. However, the aim of the study was to assess precisely this subgroup, since detection of subclinical LV dysfunction is particularly important in such patients in order to enable earlier intervention and possibly improve their prognosis.
ConclusionsAssessment of GLS and GLSR-s in our group of hypertensives detected varying degrees of LV systolic dysfunction, despite preserved ejection fraction and independently of LV structural changes. This suggests that earlier intervention in these patients may be beneficial, but only longitudinal multicenter prospective studies assessing medium- and long-term prognostic variables will clarify the clinical relevance of these early changes.
A multicenter prospective study involving a larger sample that is representative of Mediterranean-type populations and aimed at establishing cut-offs for normality of myocardial strain parameters would also be valuable.
In conclusion, assessment of sensitive parameters of LV function identified a series of early changes in an outpatient population of hypertensives with preserved ejection fraction. These changes may be potential cardiovascular risk markers in such patients and enable identification of higher risk subgroups in whom earlier and more aggressive intervention could have a significant impact on prognosis.
The clinical relevance of these findings needs to be assessed in long-term follow-up studies.
Ethical disclosuresProtection of human and animal subjectsThe authors declare that no experiments were performed on humans or animals for this study.
Confidentiality of dataThe authors declare that they have followed the protocols of their work center on the publication of patient data and that all the patients included in the study received sufficient information and gave their written informed consent to participate in the study.
Right to privacy and informed consentThe authors have obtained the written informed consent of the patients or subjects mentioned in the article. The corresponding author is in possession of this document.
Conflicts of interestThe authors have no conflicts of interest to declare.
Please cite this article as: Gonçalves S, Cortez-Dias N, Nunes A, et al. Disfunção sistólica ventricular esquerda detetada por speckle tracking em hipertensos com fração de ejeção preservada. Rev Port Cardiol. 2014;33:27–37.
