
Systemic hypertension is one of the main risk factors for cardiovascular disease (CVD). Early diagnosis and treatment of hypertension in childhood can potentially have a significant impact on future adverse outcomes.
ObjectiveTo investigate the relationship of diastolic (DBP) and systolic blood pressure (SBP) with anthropometric data and area of residence of children in municipalities of Rio Grande do Sul state, Brazil.
MethodsThis is a cross-sectional study of 709 children between six and nine years of age. Blood pressure, weight, height and waist circumference (WC) were measured. Statistical tests had a maximum significance level of 5% (p≤0.05) and the software used was SPSS version 13.0.
ResultsObesity was significantly associated with pre-hypertension, and stage 1 and 2 hypertension as assessed by DBP and SBP (≤0.05); high WC was significantly associated with a classification of pre-hypertension and stage 1 hypertension based on DBP and a classification of stage 1 and 2 hypertension based on SBP (≤0.01).
ConclusionChildren living in urban areas had significantly higher mean SBP than those living in rural areas. Those with high WC presented higher SBP and DBP compared to children with normal WC. Obese children showed higher mean SBP and DBP compared to those who were overweight or normal weight and mean SBP and DBP also increased with older age and higher mean body mass index and WC.
A hipertensão arterial sistêmica (HAS) destaca-se como um dos principais fatores de risco para doenças cardiovasculares (DCV). O diagnóstico e tratamento precoce da hipertensão na infância tem potencial de causar grande impacto contra desfechos adversos futuros.
ObjetivoVerificar a relação da pressão arterial diastólica (PAD) e sistólica (PAS) com avaliação antropométrica e a zona residencial de crianças de municípios do Rio Grande do Sul, Brasil.
MétodosTrata-se de um estudo de modelo transversal, realizado com 709 crianças de seis anos completos a nove anos incompletos. Foram aferidas a pressão arterial, peso corporal, altura e circunferência da cintura (CC). Utilizaram-se testes estatísticos, com nível de significância máximo de 5% (p≤0,05) e o software utilizado para esta análise foi o SPSS versão 13,0.
ResultadosA obesidade foi significativamente associada à pré-hipertensão, HAS grau um e dois. A CC elevada foi significativamente associada à classificação da PAD de pré-hipertensão e HAS grau 1 e de PAS HAS grau um e HAS grau dois (≤0,01).
ConclusãoAs crianças residentes na zona urbana apresentaram médias de PAS significativamente superiores às que residiam na zona rural. Aquelas com CC elevada apresentaram médias de PAS e PAD superiores em relação às crianças com CC normal. As crianças obesas demonstraram as maiores médias de PAS e PAD, em relação às com sobrepeso e às eutróficas e, à medida que aumentaram as médias de idade, índice de massa corporal e CC, as médias da PAS e PAD aumentaram também.
Cardiovascular disease (CVD) is the leading cause of disability and premature death worldwide, and hypertension is one of its main risk factors.1 Obesity is considered a global epidemic, together with an increase in cardiovascular risk factors such as hypertension. High blood pressure (BP) in childhood predicts hypertension in adulthood and is associated with cardiovascular events. Thus, early diagnosis and treatment of hypertension in childhood can potentially have a significant impact on future adverse outcomes.2
The prevalence of high BP among children has risen in recent decades, and if the condition is left undiagnosed and hence untreated it may persist into adulthood.3 This can lead to target organ damage such as left ventricular hypertrophy, increased carotid artery thickness, vascular changes in the retina, and subtle cognitive alterations.1
It is now mandatory to measure BP annually from the age of three, or before in the presence of risk factors. However, the complexity of BP measurement in children means that many health professionals do not perform the exam routinely or misinterpret the results, which may result in underdiagnosis, with irreversible consequences for the individuals involved.2
Excess weight is an important predictor of high BP in children. Thus, a child's nutritional status, as assessed by body mass index (BMI), can indicate a risk of hypertension. Obesity has been identified as an important risk factor for CVD, but other factors, whether or not linked to obesity, also affect this risk.4
Waist circumference (WC), a measure of abdominal obesity, can be used by itself to determine the risk of metabolic disorders and CVD in children and adolescents.5 Studies have shown that WC in children is related to abdominal fat and CVD risk factors such as high total and low-density lipoprotein (LDL) cholesterol and low high-density lipoprotein (HDL) cholesterol.6
The objective of this study was to investigate the relationship between diastolic (DBP) and systolic BP (SBP) and anthropometric data including WC, gender, age and area of residence in children between six and nine years of age, in the municipalities of Vale do Taquari, in Rio Grande do Sul state, Brazil.
MethodsThis is a cross-sectional, population-based study of children in the Vale do Taquari municipal school network of Rio Grande do Sul state. The data were collected from a secondary database of children and adolescents compiled in 2012 and 2013. Data for the present study included only those related to children aged between six and nine years registered in municipal schools, making up a sample of 709 children of both sexes. Written informed consent was obtained from the parents or guardians of all children included in the study. Those who were absent on the day of data collection or who refused to participate at any stage of the study were excluded from the analysis.
Height was measured in cm, to an accuracy of 1 mm, on a portable stadiometer (Avanutri). BMI was classified according to the World Health Organization (WHO)7 into four groups: thin, normal, overweight and obese. Values were classified according to the percentiles and cut-offs in the WHO tables for the age-group. WC was measured midway between the lowest rib and the iliac crest using a flexible, non-elastic tape, to an accuracy of 1 mm. WC values were analyzed based on the 50th percentile for the age-group as recommended by McCarthy et al. and classified as normal or high.8
BP was measured using an Omron Hem-742INT automatic oscillometric device (Omron Eletrônica do Brasil, São Paulo, Brazil) and appropriately sized Omron cuffs. A single reading was taken in the school environment, following the recommendations of the Brazilian Society of Cardiology's guidelines on hypertension.9 SBP and DBP were classified based on the WHO percentile curves of height for age and gender,7 and the table of BP percentiles in the Brazilian guidelines9; children with SBP and/or DBP equal to or above percentile 95 for gender, age and height were classified as having elevated BP. Percentiles 90-95 or BP>120/80 mmHg was considered pre-hypertension, percentiles 95-99+5 mmHg stage 1 hypertension and above percentile 99+5 mmHg stage 2 hypertension.
The study was approved by the research ethics committee of UNIVATES University on April 10, 2014, registration number 612.030.
Statistical analysisThe data were analyzed through tables and descriptive statistics, using Fisher's exact test, the chi-square test, the non-parametric Mann-Whitney and Kruskal-Wallis tests and Pearson's correlation analysis. Results were considered significant for a level of significance of 5% (p≤0.05). Statistical Package for the Social Sciences (SPSS) version 13.0 was used for the analysis.
ResultsThe study assessed 709 schoolchildren classified according to BMI, DBP and SBP, and WC, of whom 55% were male and 54.4% lived in rural areas. Descriptive analysis of means showed BMI was 30.92±3.2 kg/m2, DBP 150±11.96 mmHg, SBP 170±14.57 mmHg, and WC 103±8.97 cm.
With regard to nutritional status, 22.1% were overweight and 19.7% were obese or severely obese, but a majority (58.1%) were normal weight. When DBP and SBP were assessed separately, 9.2% and 24.4%, respectively, of the children were classified as having stage 1 or 2 hypertension, and 26.5% as having stage 1 or 2 hypertension based on combined SBP/DBP; in addition, 26% presented high WC.
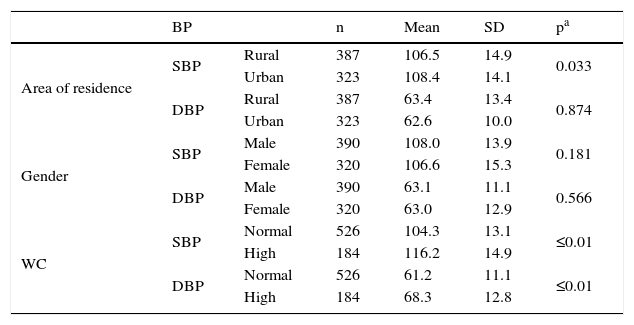
Children living in urban areas had higher mean SBP than those living in rural areas. Furthermore, those with elevated SBP and DBP also presented high WC (Table 1).
Comparison of mean systolic and diastolic blood pressure with area of residence, gender and waist circumference.
| BP | n | Mean | SD | pa | ||
|---|---|---|---|---|---|---|
| Area of residence | SBP | Rural | 387 | 106.5 | 14.9 | 0.033 |
| Urban | 323 | 108.4 | 14.1 | |||
| DBP | Rural | 387 | 63.4 | 13.4 | 0.874 | |
| Urban | 323 | 62.6 | 10.0 | |||
| Gender | SBP | Male | 390 | 108.0 | 13.9 | 0.181 |
| Female | 320 | 106.6 | 15.3 | |||
| DBP | Male | 390 | 63.1 | 11.1 | 0.566 | |
| Female | 320 | 63.0 | 12.9 | |||
| WC | SBP | Normal | 526 | 104.3 | 13.1 | ≤0.01 |
| High | 184 | 116.2 | 14.9 | |||
| DBP | Normal | 526 | 61.2 | 11.1 | ≤0.01 | |
| High | 184 | 68.3 | 12.8 |
BP: blood pressure; DBP: diastolic blood pressure; SBP: systolic blood pressure; SD: standard deviation; WC: waist circumference.
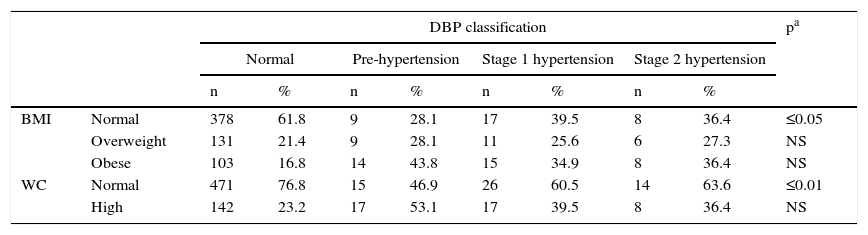
Table 2 compares nutritional status (as assessed by BMI) with WC and DBP and SBP. Normal weight and WC showed a positive association with normal DBP and SBP. Obesity was significantly associated with pre-hypertension and stage 1 and 2 hypertension as assessed by DBP and SBP, and high WC was significantly associated with a classification of pre-hypertension and stage 1 hypertension based on DBP and a classification of stage 1 and 2 hypertension based on SBP.
Comparison of body mass index and waist circumference with diastolic and systolic blood pressure.
| DBP classification | pa | |||||||||
|---|---|---|---|---|---|---|---|---|---|---|
| Normal | Pre-hypertension | Stage 1 hypertension | Stage 2 hypertension | |||||||
| n | % | n | % | n | % | n | % | |||
| BMI | Normal | 378 | 61.8 | 9 | 28.1 | 17 | 39.5 | 8 | 36.4 | ≤0.05 |
| Overweight | 131 | 21.4 | 9 | 28.1 | 11 | 25.6 | 6 | 27.3 | NS | |
| Obese | 103 | 16.8 | 14 | 43.8 | 15 | 34.9 | 8 | 36.4 | NS | |
| WC | Normal | 471 | 76.8 | 15 | 46.9 | 26 | 60.5 | 14 | 63.6 | ≤0.01 |
| High | 142 | 23.2 | 17 | 53.1 | 17 | 39.5 | 8 | 36.4 | NS | |
| SBP classification | p | |||||||||
|---|---|---|---|---|---|---|---|---|---|---|
| Normal | Pre-hypertension | Stage 1 hypertension | Stage 2 hypertension | |||||||
| n | % | n | % | n | % | n | % | |||
| BMI | Normal | 314 | 68.9 | 36 | 45.0 | 42 | 39.6 | 20 | 29.9 | ≤0.05 |
| Overweight | 91 | 19.9 | 21 | 26.3 | 28 | 26.4 | 17 | 25.4 | NS | |
| Obese | 51 | 11.2 | 23 | 28.8 | 36 | 34.0 | 30 | 44.8 | NS | |
| WC | Normal | 378 | 82.7 | 54 | 67.5 | 64 | 60.4 | 30 | 44.8 | ≤0.01 |
| High | 79 | 17.3 | 26 | 32.5 | 42 | 39.6 | 37 | 55.2 | NS | |
BMI: body mass index; DBP: diastolic blood pressure; NS: non-significant; SBP: systolic blood pressure; WC: waist circumference.
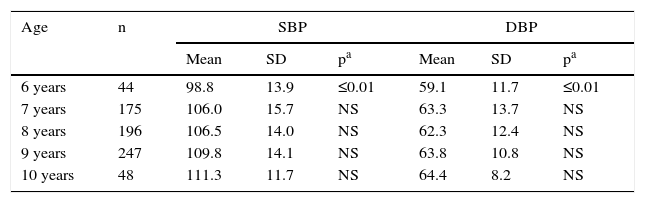
Table 3 shows that SBP and DBP varied significantly with age. For SBP, children aged 6 presented the lowest means, followed by those aged 7 and 8, who had similar values, while the highest values were observed in those aged 9 and 10. As for DBP, those aged 6 presented the lowest means compared to other ages, whose values were similar. Mean SBP and DBP showed significant differences between BMI classifications, children of normal weight presenting the lowest mean SDP and DBP, followed by those classified as overweight, and finally those classified as obese.
Relationship between age, body mass index and waist circumference with systolic and diastolic blood pressure.
| Age | n | SBP | DBP | ||||
|---|---|---|---|---|---|---|---|
| Mean | SD | pa | Mean | SD | pa | ||
| 6 years | 44 | 98.8 | 13.9 | ≤0.01 | 59.1 | 11.7 | ≤0.01 |
| 7 years | 175 | 106.0 | 15.7 | NS | 63.3 | 13.7 | NS |
| 8 years | 196 | 106.5 | 14.0 | NS | 62.3 | 12.4 | NS |
| 9 years | 247 | 109.8 | 14.1 | NS | 63.8 | 10.8 | NS |
| 10 years | 48 | 111.3 | 11.7 | NS | 64.4 | 8.2 | NS |
| BMI | n | SBP | DBP | ||||
|---|---|---|---|---|---|---|---|
| Mean | SD | pa | Mean | SD | pa | ||
| Normal | 412 | 103.5 | 13.0 | ≤0.01 | 60.5 | 10.7 | ≤0.01 |
| Overweight | 157 | 109.3 | 14.6 | NS | 63.9 | 11.1 | NS |
| Obese | 140 | 116.6 | 14.6 | NS | 69.6 | 13.7 | NS |
BMI: body mass index. DBP: diastolic blood pressure. SD: standard deviation; SBP: systolic blood pressure.
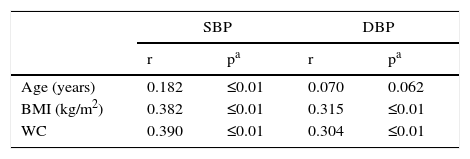
Table 4 shows the relationship between age, BMI and WC, and SBP and DBP. As BP values vary according to age, gender and height, reference cut-off values were used in the study. All correlations were statistically significant, except between age and DBP. In all other instances, the correlations were direct, i.e. as the means of age, BMI and WC increased, so did the means of SBP and DBP.
Relationship between age, body mass index and waist circumference and systolic and diastolic blood pressure.
| SBP | DBP | |||
|---|---|---|---|---|
| r | pa | r | pa | |
| Age (years) | 0.182 | ≤0.01 | 0.070 | 0.062 |
| BMI (kg/m2) | 0.382 | ≤0.01 | 0.315 | ≤0.01 |
| WC | 0.390 | ≤0.01 | 0.304 | ≤0.01 |
BMI: body mass index; DBP: diastolic blood pressure; SBP: systolic blood pressure; WC: waist circumference.
In this study, 22.1% of the children were overweight and 19.7% were obese or severely obese, higher percentages than in studies by Pedersoli et al.10 in children aged 7 to 10 years in the municipality of Porto Velho, which reported 16.5% overweight and 11.2% obese, and Lima et al.,11 in which 15.1% were overweight and 12.3% obese, but lower than in Passos et al.,12 who reported 26% overweight and 25% obesity in both sexes and Moraes et al.,2 who found 21% overweight and 27% obesity in children of both sexes in São Paulo schools. In a study by Burgos et al.4 26.6% of children were classified as overweight or obese, and Lee et al.13 observed that 28.9% of children were overweight or obese, both lower percentages than in the present study.
Obesity in childhood is a growing problem, affecting 25-30% of the pediatric population. This is attributed mainly to environmental and sociocultural factors, including promotion of unhealthy foods with high fat content and lack of exercise.14 The WHO estimated that in 2015 there were 700 million individuals with health problems due to obesity, 43 million of whom were overweight children under the age of five.15
Faced with the increasing prevalence of overweight and obesity in ever younger children, Gabriel et al.16 highlighted the positive effects of the Brazilian National School Nutrition Program on physical and psychosocial growth and development, learning, academic performance and development of healthy eating habits among children attending state schools, through educational actions on diet and nutrition and the provision of free and healthy meals.
In our study, 26% of the children had high WC, lower than the 30.2% reported by Iampolsky et al.17 in schoolchildren in the Santo André municipality of São Paulo and the 42% observed by Souza et al.18 WC is a useful tool in assessing CVD risk factors in children and adolescents.19 Friedemann et al.20 highlight WC as an important predictor of changes in lipid, lipoprotein and apolipoprotein levels in young people.21 Cardiovascular risk has been increasing over the years, and is now a major public health problem associated with high rates of morbidity and mortality, as well as its negative impact on patients’ quality of life.22 Abdominal fat is associated with dyslipidemia, hypertension and glucose metabolism disorders, and WC is a good indicator of body fat distribution and cardiovascular risk,23 as is BMI, which reflects other markers of adiposity.24
In the study population, 11.8% were classified as pre-hypertensive, while 26.5% had stage 1 or 2 hypertension based on SBP/DBP values, higher percentages than in a study by Moraes et al.,2 who reported that 3.4% were pre-hypertensive and 3.9% had stage 1 or 2 hypertension based on DBP/SBP and a study by Rosini et al.5 of schoolchildren in Guabiruba, in which 6.1% were pre-hypertensive and 4.5% hypertensive. Rinaldi et al.25 found that 26% of schoolchildren presented elevated SBP/DBP, and Lima et al.11 reported high BP in 20.4% of children. Although it is known that hypertension in adulthood begins in childhood, the fact that BP is not generally measured in children has led to the belief that hypertension does not occur at these ages, and thus children are often not diagnosed, whereas early intervention could prevent worsening of the disease in the future.26
Monego and Jardim,27 Moraes et al.,2 Carvalho et al.28 and Lima et al.11 all observed a significant association between overweight and hypertension, as did the present study, in which obesity was significantly associated with pre-hypertension and stage 1 and 2 hypertension. Moreover, our study found that normal weight was significantly associated with normal SBP and DBP, as also reported by Batista et al.29 Irrespective of the criterion used to classify nutritional status, BP values tend to increase in parallel, from low weight to obesity.2
Given that BMI and WC show a relationship with BP, it is important to stress that elevated BP levels in children are not as uncommon as previously thought, and that children who are overweight or have a family history of hypertension and/or had low birth weight should receive particular attention due to their high risk for hypertension. Poor compliance by physicians with the current guidelines of routine BP assessment in children from the age of three is a problem that requires specific measures on the part of public health policy-makers, since it leads to underdiagnosis, with possibly irreversible consequences in the future for some individuals.30
In a study by Batista et al. on arterial stiffness,29 the main clinical characteristics of the children studied were nutritional status and 39% were overweight and had higher mean DBP and SBP.
Our study found significant direct correlations: as mean age, BMI and WC increased, so did mean SBP and DBP, a similar result to Burgos et al.4 and Batista et al.29 In a study of 7- and 8-year-old children, Paschoal et al.30 demonstrated that mean SBP was lower in those of normal weight compared to those classified as obese. Nobre et al.,31 in a study assessing the effect of BMI on BP, found that the proportions of subjects with elevated SBP, DBP and SBP/DBP were significantly greater among those with high WC in both sexes.
The present study showed that mean SBP was significantly lower in six-year-olds, followed by those aged seven and eight; six-year-olds also presented the lowest mean DBP, with no difference between the other ages. The study by Moraes et al.2 found no significant association between high BP and age.
The only correlation reported with gender is higher DBP in males (p=0.02).2 In contrast to Rosa et al.,32 who showed no significant association between high SBP/DBP and age, Rinaldi et al.25 and Santos et al.33 argue that SBP and DBP values increase with age.
All children who presented obesity or high BP were referred to local health centers for medical consultation and nutritional guidance. The variables studied in the present study are being assessed in other municipalities for analysis.
One limitation of the study is the fact that BP was measured three times only when the first two measurements showed markedly different readings. In addition, height was not considered a factor for increased SBP in children with obesity or high WC.
ConclusionChildren living in urban areas had significantly higher mean SBP than those living in rural areas, possible due to a more industrial, sodium-rich diet. Furthermore, children with high WC had significantly higher mean SBP and DBP than those with normal WC. Obesity was thus significantly associated with pre-hypertension and stage 1 and 2 hypertension, for both SBP and DBP. High WC was significantly associated with a classification of pre-hypertension or stage 1 hypertension based on DBP and a classification of stage 1 or 2 hypertension based on SBP.
Children aged nine and ten presented higher mean SBP and DBP than those aged six to eight, and obese subjects showed higher mean SBP and DBP compared to those who were overweight or normal weight. Mean SBP and DBP also increased with older age and higher mean BMI and WC.
Ethical disclosuresProtection of human and animal subjectsThe authors declare that the procedures followed were in accordance with the regulations of the relevant clinical research ethics committee and with those of the Code of Ethics of the World Medical Association (Declaration of Helsinki).
Confidentiality of dataThe authors declare that they have followed the protocols of their work center on the publication of patient data.
Right to privacy and informed consentThe authors have obtained the written informed consent of the patients or subjects mentioned in the article. The corresponding author is in possession of this document.
Conflicts of interestThe authors have no conflicts of interest to declare.
Please cite this article as: Fraporti MI, Scherer Adami F, Dutra Rosolen M. Fatores de risco cardiovascular em crianças. Rev Port Cardiol. 2017;36:699–705.
