
Cardiovascular disease is the leading cause of morbidity, mortality and disability in Portugal. Socioeconomic level is known to influence health status but there is scant evidence on socioeconomic inequalities in cardiovascular disease in Portugal.
AimTo analyze the distribution of cardiovascular disease in the Portuguese population according to socioeconomic status.
MethodsWe conducted a cross-sectional study using data from the fourth National Health Survey on a representative sample of the Portuguese population. Socioeconomic inequalities in cardiovascular disease, risk factors and number of medical visits were analyzed using odds ratios according to socioeconomic status (household equivalent income) in the adult population (35–74 years). Comparisons focused on the top and bottom 50% and 10% of household income distribution.
ResultsOf the 21 807 individuals included, 53.3% were female, and mean age was 54±11 years. Cardiovascular disease, stroke, ischemic heart disease, hypertension, diabetes, obesity and physical inactivity were associated with lower socioeconomic status, while smoking was associated with higher status; number of medical visits and psychological distress showed no association. When present, inequality was greater at the extremes of income distribution.
ConclusionsThe results reveal an association between morbidity, lifestyle and socioeconomic status. They also suggest that besides improved access to effective medical intervention, there is a need for a comprehensive strategy for health promotion and disease prevention that takes account of individual, cultural and socioeconomic characteristics.
Em Portugal, as doenças cardiovasculares são a principal causa de morbi-mortalidade e invalidez. Sabe-se que o nível socioeconómico influencia o estado de saúde, todavia, são escassas as evidências sobre as desigualdades socioeconómicas nas doenças cardiovasculares em Portugal.
ObjetivoAnalisar a distribuição das doenças cardiovasculares de acordo com o nível socioeconómico da população portuguesa.
MétodosFoi realizado um estudo transversal usando a base de dados do 4.° Inquérito Nacional de Saúde (inquérito representativo da população portuguesa). As desigualdades socioeconómicas nas doenças cardiovasculares, fatores de risco e número de consultas médicas foram analisadas através dos odds ratios por nível socioeconómico (rendimento familiar equivalente) na população adulta (35-74 anos). As comparações incidiram sobre os 50 e 10% das famílias mais ricas e mais pobres.
ResultadosDos 21.807 indivíduos, 53,3% são do sexo feminino e a idade média é de 54 ± 11 anos. As doenças cardiovasculares, acidente vascular cerebral, doença cardíaca isquémica, hipertensão arterial, diabetes mellitus, obesidade e sedentarismo estão associados aos níveis socioeconómicos mais baixos; o tabagismo está associado aos níveis mais elevados; enquanto o número de consultas médicas e sofrimento psicológico não apresentam associação. Nos casos em que existe desigualdade ela é significativamente maior quando se consideram os extremos da distribuição do rendimento familiar.
ConclusõesOs resultados revelam a associação entre morbilidade, estilos de vida e nível socioeconómico e sugerem que, para além de intervenções médicas eficazes, são necessárias políticas de saúde mais abrangentes de acordo com as características individuais, culturais e socioeconómicas da população, dirigidas à promoção da saúde e prevenção da doença.
body mass index
cardiovascular disease
cardiovascular risk factor
diabetes mellitus
hypertension
International Classification of Diseases
ischemic heart disease
Mental Health Inventory
National Health Survey
National Institute of Health
Organization for Economic Cooperation and Development
odds ratio
socioeconomic status
World Health Organization
Portugal has seen significant improvements in the health status of its citizens over the last 25 years. Since 1980, when the country had some the worst health indicators in Europe, there has been continuous improvement, closing the gap in relation to other countries. Indicators that have improved include perinatal and infant mortality, mean life expectancy at birth, potential years of life lost before age 65 and mortality before age 65 from the most common causes, including ischemic heart disease (IHD), stroke and motor vehicle accidents.1
Cardiovascular disease (CVD) is among the principal causes of morbidity, mortality and disability in Portugal, particularly stroke and IHD, which are the third and fourth cause of potential years of life lost and the leading cause of death in Portugal in both sexes.2 The increasing societal burden of these diseases has social, economic and cultural impacts and highlights the need for health promotion and disease prevention strategies that take account of different populational characteristics, such as gender, ethnicity and socioeconomic status (SES).2
The etiology of CVD is atherosclerotic in most cases. Various cardiovascular risk factors (CVRFs), both modifiable (including hypertension [HTN], diabetes mellitus [DM], hypercholesterolemia, dyslipidemia, obesity, smoking, physical inactivity, diet, alcohol abuse and stress) and non-modifiable (gender, age, and personal and family history), contribute to its onset, clinical course, complications and prognosis. It is estimated that 75% of cases of CVD can be attributed to modifiable CVRFs and are thus preventable, treatable and/or controllable.3
The 2004–2010 and 2012–2016 Portuguese National Health Plans2,4 established various priorities, including CVD prevention, treatment and rehabilitation and promotion of healthy lifestyles, as well as equality in health care.
Various theories have been proposed to explain the association between SES and CVD, in most of which exposure to triggering factors, patient needs and access to resources are important variables, which demonstrates the crucial role SES plays in health and how it interacts with other factors. What is certain is that differences in health between socioeconomic groups are partly due to their different social and cultural experiences. Differences in access to health care can lead to inequity and injustice, and should therefore be identified and corrected.5–7
According to the World Health Organization (WHO), in spite of the progress made there are still significant differences in the health status of Portuguese citizens according to gender, geographical region and SES.1 The health system currently faces the challenge of consolidating and improving the population's health status, reducing inequalities between groups and meeting the expectations of the people, while dealing with the problems of risk behaviors including dietary habits and smoking and of the financial sustainability of the health system.1,8
Despite the importance of these issues, particularly with regard to CVD, there has been little research on the subject. There is thus a need to conduct studies analyzing the relation of socioeconomic inequalities to CVD in Portugal, in order to fill the gaps in our knowledge and provide data on which to base policies for reorganizing health care provision to respond to citizens’ needs.
The present study sets out to analyze the distribution of CVD using data from the Fourth National Health Survey (NHS), classifying the population according to household equivalent income and determining the distribution of CVD, IHD, stroke and CVRFs using odds ratios (OR) in the adult population aged 35–74 years.
MethodsWe conducted an exploratory descriptive cross-sectional study with the overall objective of analyzing the association between CVD, its risk factors, and use of health services according to SES in the Portuguese population. Specific objectives were:
- •
to analyze the association between IHD and SES;
- •
to analyze the association between stroke and SES;
- •
to analyze the association between CVRFs (DM, HTN, obesity, smoking, psychological distress and physical inactivity) and SES; and
- •
to analyze the association between number of medical visits and SES.
The Fourth NHS was conducted under the aegis of the National Institute of Statistics and the Dr. Ricardo Jorge National Institute of Health (NIH).9
The population covered by the survey consisted of individuals living in family households in Portugal at the time of the survey; those living in collective or other non-traditional types of housing were excluded. In each region, the areas selected were distributed in a relatively uniform manner by three-monthly and weekly periods in order to minimize seasonal effects on the results. The interviews were conducted in person between February 2005 and February 2006 by specially trained interviewers of all individuals residing in each household included in the selected sample and data were recorded in digital format. Full interviews were achieved in 76% of cases.9
The sample consisted of 15 239 households, corresponding to 41 193 individuals (15 457 families).9
Study populationThe study population consisted of 21 807 adults (aged 35–74 inclusive) from the Fourth NHS database for whom information was available on household income.
Study variablesDemographic characteristicsGender was analyzed as a nominal qualitative variable; age was analyzed as a discrete quantitative variable based on individual data and as an ordinal qualitative variable based on four age-groups: 35–44, 45–54, 55–64 and 65–74 years.
Socioeconomic statusThe variable used to assess SES was the modified OECD equivalence scale, also used by the National Institute of Statistics when analyzing household income data in other studies,10 calculated according to the following formula:
where the first adult has a weight of 1.0, the second and subsequent adults a weight of 0.5 (x), and dependent children a weight of 0.3 (y).11Cardiovascular disease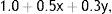
Stroke was assessed according to the International Classification of Diseases, version 10 (ICD-10) codes G45-G46 and I60-I6912 for the questions in the NHS concerning reasons for temporary disability, long-term disease, medical visits and diagnosis of stroke reported by a health professional. Stroke was considered present when there was an affirmative response to any of the above questions.
IHC was assessed in a similar way to stroke, based on ICD-10 codes I20-I2512 for NIH questions concerning reasons for temporary disability, long-term disease, medical visits and diagnosis of acute myocardial infarction reported by a health professional. IHD was considered present when there was an affirmative response to any of the above questions.
CVD was considered present when there was an affirmative response to stroke or IHD, as well as to diseases of the cardiovascular systems (ICD-10 codes I00-I99).12 The three variables were analyzed as nominal qualitative variables.
Cardiovascular risk factorsObesity was assessed by body mass index (BMI), calculated as weight in kilograms divided by height in meters squared, obesity being defined as BMI of ≥30 kg/m2.
DM was assessed on the basis of ICD-10 codes E10-E1412 for NIH questions concerning reasons for temporary disability, long-term disease, medical visits and diagnosis of DM reported by a health professional. DM was considered present when there was an affirmative response to any of the above questions.
HTN was assessed on the basis of ICD-10 codes I10-I1512 for NIH questions concerning reasons for temporary disability, long-term disease, medical visits and diagnosis of HTN reported by a health professional. Thus, HTN was considered present when there was an affirmative response to any of the above questions.
Smoking was assessed by two categories – current and former smokers. Time since smoking cessation was not analyzed to differentiate those with greater or lesser cardiovascular risk, as the number of years since the onset of the diseases under study (with the exception of questions related to temporary or long-term disability) was not taken into account. It was thus impossible to determine whether individuals were smokers or non-smokers (or how long they had been former smokers) at the time of stroke or IHD.
Physical inactivity was assessed by responses to the question concerning exercise and its duration, individuals performing less than 30 minutes of moderate-intensity physical activity five days a week being considered sedentary.13 It should be noted that the NIH questions concerning physical activity were only applied during weeks 14–26 of the survey.
Psychological distress was assessed by the five-item Mental Health Inventory (MHI-5), a scale used to evaluate positive and negative aspects of mental health.14 The MHI-5 score was calculated by the rating attributed to each of the responses regarding feeling “nervous”, “depressed”, “sad”, “calm” and “happy”. Each item has six possible responses ranging from ‘all of the time’ to ‘none of the time’ rated from 0 to 5 in ascending order in the case of ‘nervous’, ‘depressed’ and ‘sad’ and descending order in the case of ‘calm’ and ‘happy’. Summing up the different ratings gives a final score between 0 and 25, which is linearly transformed to a 0–100 point index. A score of zero indicates the worst mental health, while 100 reflects the best. Several authors report that a score of ≤52 indicates depressive symptoms and clinical signs of psychological disorder or distress.15–17
This last variable was treated as a continuous quantitative variable for individual data and as an ordinal qualitative variable for groups according to MHI ≤52 and MHI >52. All other CVRFs were treated as nominal qualitative variables.
Use of health care servicesThe number of medical visits in the three months prior to the interviews was analyzed as a discrete quantitative variable for individual data and as a nominal qualitative variable when grouped according to one or more visits in the previous three months.
Statistical analysisExcel 2007© and SPSS Statistics 17.0 were used to analyze the data.
Absolute, relative and, when applicable, cumulative relative frequencies were used to characterize the sample, and minimum and maximum values, means and standard deviations were determined for quantitative variables.
ORs and 95% confidence intervals (CI) were used for analysis of the association between CVD, CVRFs and SES. ORs for SES were calculated by comparing population groups with higher and lower scores on the OECD equivalence scale: the top 50% of the sample with the bottom 50% and the top 10% with the bottom 10%. The ORs between SES were taken as the ratio between the likelihood of having CVD or CVRFs among the poorer households (comparing the poorest with CVRFs or CVD with those without CVRFs or CVD) in relation to the better-off (comparing the better-off with CVRFs or CVD with those without CVRFs or CVD), a ratio of >1 reflecting an association between morbidity and lower SES, a ratio of <1 showing an association between morbidity and higher SES, and a ratio of 1 (or the CI containing 1) indicating no significant association.18
ResultsPopulation characteristicsThe study population included 21 807 individuals, 53.34% (n=11 619) female, mean age 54±11 years.
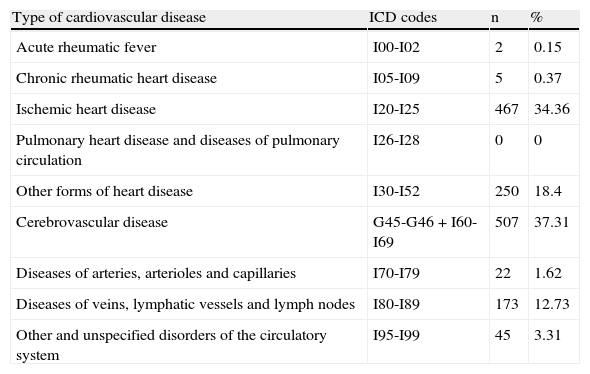
Of the various types of CVD, the most common were stroke (37.31%) and IHD (34.36%) (Table 1).
Distribution of types of cardiovascular diseases according to ICD-10 codes.12
| Type of cardiovascular disease | ICD codes | n | % |
| Acute rheumatic fever | I00-I02 | 2 | 0.15 |
| Chronic rheumatic heart disease | I05-I09 | 5 | 0.37 |
| Ischemic heart disease | I20-I25 | 467 | 34.36 |
| Pulmonary heart disease and diseases of pulmonary circulation | I26-I28 | 0 | 0 |
| Other forms of heart disease | I30-I52 | 250 | 18.4 |
| Cerebrovascular disease | G45-G46 + I60-I69 | 507 | 37.31 |
| Diseases of arteries, arterioles and capillaries | I70-I79 | 22 | 1.62 |
| Diseases of veins, lymphatic vessels and lymph nodes | I80-I89 | 173 | 12.73 |
| Other and unspecified disorders of the circulatory system | I95-I99 | 45 | 3.31 |
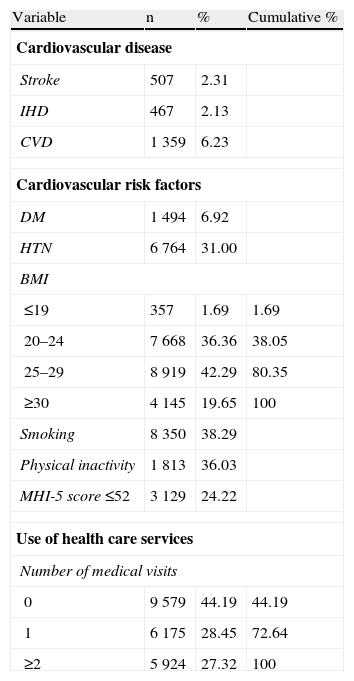
Analysis of the NIH sample (Table 2) showed that 6.23% of those surveyed had or had had CVD, 2.31% stroke and 2.13% IHD. HTN was found in 31.00%, DM in 6.92%, obesity in 19.65% (BMI ranged between 7.50 and 67.21 kg/m2, mean 26.63±4.39 kg/m2), smoking in 38.29%, physical inactivity in 36.03% and psychological distress in 24.22% (mean MHI-5 score: 60±10). On analysis of use of health care services, 55.81% of the sample reported at least one medical visit in the previous three months (mean 1.19±1.88, ranging between 0–10).
Distribution of cardiovascular disease, cardiovascular risk factors and use of health care services in the overall population.
| Variable | n | % | Cumulative % |
| Cardiovascular disease | |||
| Stroke | 507 | 2.31 | |
| IHD | 467 | 2.13 | |
| CVD | 1 359 | 6.23 | |
| Cardiovascular risk factors | |||
| DM | 1 494 | 6.92 | |
| HTN | 6 764 | 31.00 | |
| BMI | |||
| ≤19 | 357 | 1.69 | 1.69 |
| 20–24 | 7 668 | 36.36 | 38.05 |
| 25–29 | 8 919 | 42.29 | 80.35 |
| ≥30 | 4 145 | 19.65 | 100 |
| Smoking | 8 350 | 38.29 | |
| Physical inactivity | 1 813 | 36.03 | |
| MHI-5 score ≤52 | 3 129 | 24.22 | |
| Use of health care services | |||
| Number of medical visits | |||
| 0 | 9 579 | 44.19 | 44.19 |
| 1 | 6 175 | 28.45 | 72.64 |
| ≥2 | 5 924 | 27.32 | 100 |
BMI: body mass index; CVD: cardiovascular disease; DM: diabetes mellitus; HTN: hypertension; IHD: ischemic heart disease; MHI-5: five-item Mental Health Inventory.
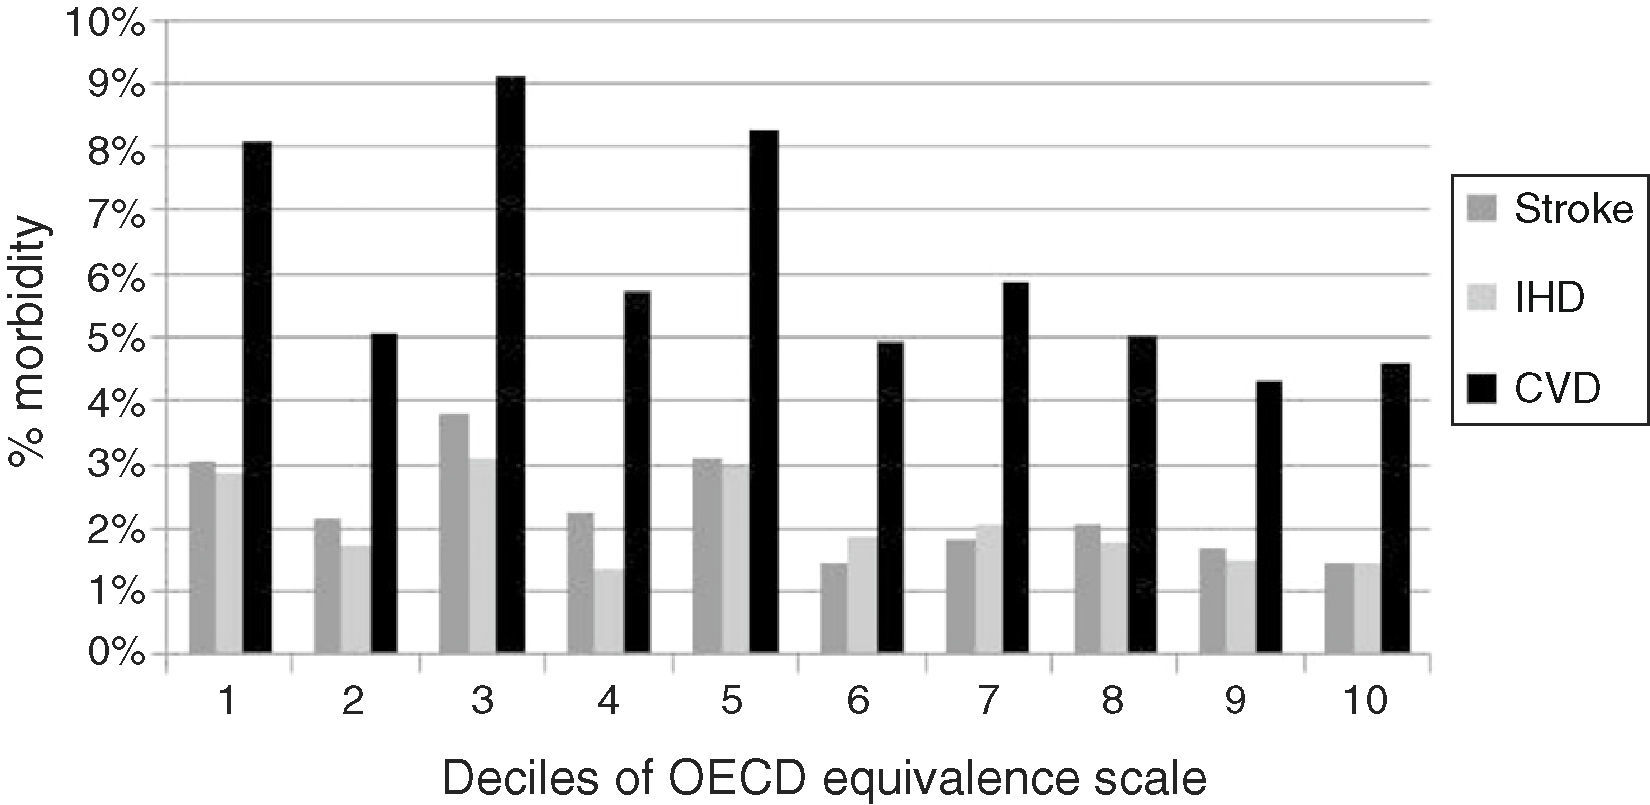
Analysis of the distribution of CVD by ascending deciles of household income (Figure 1) showed CVD, stroke and IHD, as well as most CVRFs, to be less common among those with higher levels of income.
 CVD: cardiovascular disease;
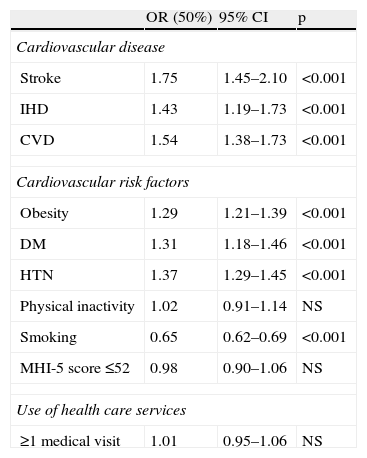
 Comparison of OR values for SES between the wealthiest and poorest 50% of the population (Table 3) showed that CVD, IHD, stroke, obesity, DM and HTN were more prevalent among those with lower SES, while smoking was associated with higher SES. There was no statistically significant association between physical inactivity, psychological distress or number of medical visits and SES (Table 3).
Odds ratios of cardiovascular disease, cardiovascular risk factors and medical visits according to socioeconomic status (comparison between bottom 50% and top 50% of income distribution).
| OR (50%) | 95% CI | p | |
| Cardiovascular disease | |||
| Stroke | 1.75 | 1.45–2.10 | <0.001 |
| IHD | 1.43 | 1.19–1.73 | <0.001 |
| CVD | 1.54 | 1.38–1.73 | <0.001 |
| Cardiovascular risk factors | |||
| Obesity | 1.29 | 1.21–1.39 | <0.001 |
| DM | 1.31 | 1.18–1.46 | <0.001 |
| HTN | 1.37 | 1.29–1.45 | <0.001 |
| Physical inactivity | 1.02 | 0.91–1.14 | NS |
| Smoking | 0.65 | 0.62–0.69 | <0.001 |
| MHI-5 score ≤52 | 0.98 | 0.90–1.06 | NS |
| Use of health care services | |||
| ≥1 medical visit | 1.01 | 0.95–1.06 | NS |
CVD: cardiovascular disease; DM: diabetes mellitus; HTN: hypertension; IHD: ischemic heart disease; MHI-5: five-item Mental Health Inventory; OR (50%): odds ratio comparing bottom 50% with top 50% of household income.
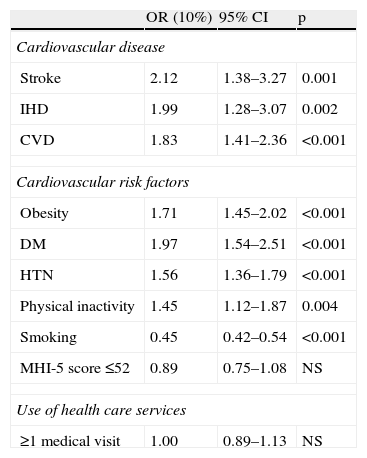
Comparison between extremes of income (bottom 10% and top 10%) revealed greater inequalities in CVD and CVRFs (Table 4). For example, for CVD while the OR between the bottom 50% and the top 50% was 1.75, the OR between the bottom 10% and the top 10% was 2.12, and for DM, OR (50%) was 1.31, while OR (10%) was 1.97.
Odds ratios of cardiovascular disease, cardiovascular risk factors and medical visits according to socioeconomic status (comparison between bottom 10% and top 10% of income distribution).
| OR (10%) | 95% CI | p | |
| Cardiovascular disease | |||
| Stroke | 2.12 | 1.38–3.27 | 0.001 |
| IHD | 1.99 | 1.28–3.07 | 0.002 |
| CVD | 1.83 | 1.41–2.36 | <0.001 |
| Cardiovascular risk factors | |||
| Obesity | 1.71 | 1.45–2.02 | <0.001 |
| DM | 1.97 | 1.54–2.51 | <0.001 |
| HTN | 1.56 | 1.36–1.79 | <0.001 |
| Physical inactivity | 1.45 | 1.12–1.87 | 0.004 |
| Smoking | 0.45 | 0.42–0.54 | <0.001 |
| MHI-5 score ≤52 | 0.89 | 0.75–1.08 | NS |
| Use of health care services | |||
| ≥1 medical visit | 1.00 | 0.89–1.13 | NS |
CVD: cardiovascular disease; DM: diabetes mellitus; HTN: hypertension; IHD: ischemic heart disease; MHI-5: five-item Mental Health Inventory; OR (10%): odds ratio comparing bottom 10% with top 10% of household income.
The aim of this study was to analyze the distribution of CVD according to SES in the Portuguese population. The most common forms of CVD were stroke and IHD (37.31% and 34.26%, respectively). Stroke, IHD and CVD were associated with lower income groups, rates of stroke showing the greatest socioeconomic inequality; inequalities tended to increase at the extremes of household income distribution.
There have been few studies on economic inequalities in cardiovascular morbidity, and no study of this kind in Portugal was found in the literature. One study of socioeconomic inequalities in cardiovascular mortality19 used indices for occupational (divided into manual and non-manual work) and educational groups based on mortality rates for stroke, IHD and CVD and ORs for risk factors according to SES, and concluded that mortality is higher due to stroke and CVD in those with lower SES and due to IHD in those with higher SES. These findings are not comparable with those of the present study since it used a different methodology, assessed mortality rather than morbidity and covered a different period (1980–1982). However, it is interesting to note that our study revealed higher morbidity due to IHD in the lower socioeconomic groups, with less inequality for stroke, in contrast to the above study based on mortality data.
Our study demonstrated socioeconomic inequalities in cardiovascular morbidity. Other studies have shown similar differences in Portugal for morbidity in general, based on SES indicators such as education, occupation and income and using various data sources, including the NIH.20–27
It should be noted that the present study did not set out to analyze cause and effect relations between CVRFs, CVD and SES.
With regard to CVRFs, smoking was more strongly associated with higher SES, as reported by various other authors.19,28,29
The ORs for psychological distress did not reveal significant inequality according to SES. A meta-analysis of 56 studies on socioeconomic inequality and depression30 showed a wide range of indicators, methodologies and results. In most studies, an OR of >1 for depression, and thus a greater frequency, was observed in those with lower SES. However, apart from the fact that SES was assessed by education, occupation, wealth or social class in most studies and by income in only six, they covered a long period of time (published between 1980 and 2001) and obtained conflicting results (ORs ranging between 0.53 and 7.09). One study of epidemiologic evidence for the relation between SES and depression31 found a social gradient, those with lower educational levels being more likely to be affected. These findings conflict with our results, but our decision to assess psychological distress through MHI-5 and SES through the OECD equivalence scale, together with the fact that no similar studies have been conducted in Portugal, makes it difficult to put our results into context.
In our study population 24.22% of individuals had an MHI-5 score of ≤52, reflecting psychological distress. Studies assessing mental health status in other countries have shown similar results to the present study, which indicates that while the distribution of mental health disorders may vary within a population, results are generally similar between populations with different characteristics. One study of the value of MHI-3 and MHI-5 in screening for depressive symptoms in Japan32 concluded that 23% of the general population had depressive symptoms. Another measuring the mental health of the Dutch population using the MHI-533 concluded that 21% had some form of mental disorder.
The OR values for the risk factors HTN, DM and obesity showed an association with lower SES, in line with the Eurothine Final Report,34 which found a greater prevalence of DM and obesity in groups with lower income and educational level, the study by Mackenbach et al.,19 which revealed a higher prevalence of obesity in these groups, a study by Hardy35 which found a greater prevalence of HTN in those with lower SES, and studies by Marmot and colleagues,36,37 which found a higher prevalence of physical inactivity and HTN in those with lower SES as assessed by employment grade.
The relative frequencies of HTN, DM and obesity were similar in the present study to those reported in the literature. HTN was found in 31% of the sample, in agreement with other studies in the Portuguese population38 which showed an overall prevalence of 24%, ranging between 22% and 36% according to sociodemographic characteristics and geographical location, while DM was found in 6.52% of individuals, which is also in agreement with other studies in the Portuguese population39 that revealed a prevalence of 8.9%, ranging between 6.5% and 17.4%.
In the present study, obesity was found in 19.65% of the sample and pre-obesity in 42.29%, which corroborates other studies40 that recorded levels of obesity and pre-obesity of 14% and 40%, respectively in the Portuguese population.
Physical inactivity did not show significant socioeconomic inequality for OR (50%), but OR (10%) did reveal significant inequality, being associated with lower SES. This finding is supported by studies such as Eurothine34 which found a greater prevalence of physical inactivity among the poorest sections of society. However, the low level of physical inactivity in the present study (36.03%) was not seen in various studies.2,41 This may be due to the fact that the NIH questions concerning physical activity were only applied to 24.40% of the total sample.
Analysis of the distribution of medical visits in the three months prior to the interviews showed that individuals with CVD or IHD were more likely to seek medical attention than those with stroke (OR 4.91, 3.91 and 2.81, respectively), which may indicate that less social importance is attributed to stroke.
No association was found between the distribution of medical visits and SES, which is paradoxical since diseases are more prevalent among the poor but the number of medical visits does not reflect this. This would indicate possible inequalities in the use or provision of health care services in favor of the better-off, as shown in a study by Pereira,42 who concluded that there was inequality in provision in favor of those with higher SES, irrespective of the morbidity indicator chosen.
The results obtained highlight the burden of cardiovascular morbidity and the complexity of the various health factors that affect it. The study also reinforces the findings of the WHO regarding the Portuguese National Health Plan.43 CVD and CVRFs related to lifestyle (healthy or otherwise) present significant socioeconomic inequalities in prevalence, reflecting the fact that health policies are still failing to recognize, monitor and correct socioeconomic inequalities in terms of behaviors and lifestyle, as well as in terms of treatment and rehabilitation. Besides effective medical intervention, comprehensive and targeted strategies are required for health promotion and disease prevention that take account of individual, cultural and socioeconomic characteristics.
We propose that the current National Health Plan should continue to consider equality and CVD among its priorities, but should establish quantifiable targets for evaluating, monitoring, detecting and correcting any departure from the strategies planned.
ConclusionCVD and most CVRFs are more prevalent among the poor, which suggests that SES may affect the behaviors and lifestyle that are responsible for CVD. In general, the better-off are more likely to smoke, while the poor have a higher prevalence of HTN, DM and obesity. Given that modifiable CVRFs are mainly responsible for the onset, evolution and complications of CVD and that they are subject to socioeconomic inequalities, it is strange that current health policies do not address this issue and seem incapable of establishing specific programs according to individual socioeconomic characteristics.
Ethical disclosuresProtection of human and animal subjectsThe authors declare that no experiments were performed on humans or animals for this study.
Confidentiality of dataThe authors declare that they have followed the protocols of their work center on the publication of patient data and that all the patients included in the study received sufficient information and gave their written informed consent to participate in the study.
Right to privacy and informed consentThe authors declare that no patient data appear in this article.
Conflict of interestThe authors have no conflict of interest to declare.
We thank the National Institute of Statistics and the Dr. Ricardo Jorge National Institute of Health for access to data from the Fourth National Health Survey.
Please cite this article as: Ribeiro S, Furtado C, Pereira J. Associação entre as doenças cardiovasculares e o nível socioeconómico em Portugal. Rev Port Cardiol. 2013;32:847–854.
